Open Space/Green Space Module
Experiential Learning Module: Is it GREEN in our Backyard?
BIG QUEstion

How do human activities impact the environment and how can we respond to it?
overview
Understanding land use and the impact of human activity is important when learning about the environment and biodiversity. To scaffold student engagement with and understanding of such concerns, they will examine their communities using an inquiry place-based learning approach. Students will engage in the process of interpreting and extrapolating information from a remotely sensed image of their neighborhood, including comparing and contrasting historical and contemporary images, validating the images, examining secondary data to add perspective, and evaluate land use decisions to make informed recommendations about land use in the community.
The module consists of four challenges:
- Students will develop definitions of green space, compare and contrast them with definitions of open space, and apply to spaces in the neighborhood.
- By looking at US Census maps, students will be able to list how population patterns are changing.
- By looking at remotely sensed images with GIS layers, students will be able to identify space in their city that is available for conversion to different uses for the benefit of their community and the environment.
- Based on their findings, student will create a defendable proposal for the development of an open space in their area that they believe is available for conversion for the benefit of that community and environment.
STANDARDS
Focus Standards
Next Generation Science Standards
HS-LS2-7. Design, evaluate, and refine a solution for reducing the impacts of human activities on the environment and biodiversity
Disciplinary Core Ideas
College, Career, and Civic Life
D2.Geo.2.9-12. Use maps, satellite images, photographs, and other representations to explain relationships between the locations of places and regions and their political, cultural, and economic dynamics.
National Geography Standards
Geography Standard 14. How human actions modify the physical environment
Prior Standards: Anticipated Prior Knowledge
Next Generation Science Standards
MS-ESS3-3. Apply scientific principles to design a method for monitoring and minimizing a human impact on the environment.
College, Career, and Civic Life
D2.Geo.1.9-12. Use geospatial and related technologies to create maps to display and explain the spatial patterns of cultural and environmental characteristics.
LEARNING TARGETS
By the end of this module students will be able to recommend different uses for open spaces in the neighborhood that could benefit the community and the environment. They will do this through identifying locations and measuring sizes of open spaces by comparing current and historical remote sensing images.
CONTENT BACKGROUND
Urbanization in the United States has increased, particularly since the middle of the twentieth century. According to the Population Data Sheet for 2015, 81% of people in this country live in urban areas (Population Data Sheet 2015). However, some counties are more crowded than others. In other words, population density varies by county.
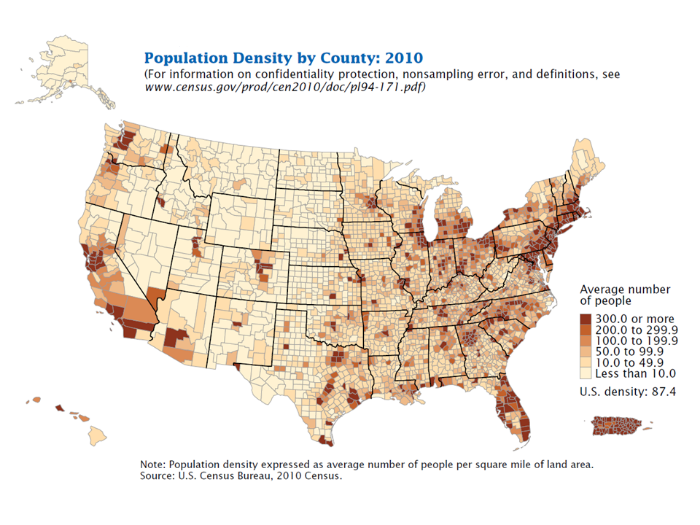
In addition to population density, the physical and human geography of each county is different. For example, some counties are more urban than others. The map shows population density of counties in the United States in 2010. Urban areas have higher densities than rural. Which regions of the country do you think are more urbanized?
Climate regions and landforms are diverse across the United States. People are employed in different professions depending on where they live. Over time we have used the land in changing ways and our impact on the environment can be seen in the landscapes of our local communities.
One way to measure our impact on the environment is to use the following formula:
I (Impact on the Environment) = P (Population) X A (Affluence) X T (Technology)
Population can be determined by examining population density, while affluence (or standard of living) could be measured using a variable such as income per capita. The impact of technology is more difficult to assess, however. In many cases, people suggest that the increasing use of technology has a negative impact on the environment, but this is not always the case. In fact, new advances in technology, such as alternative energy sources, can improve human’s impact on the environment.
For this lesson, students will focus on urbanization and land cover. Using remote sensing and spatial thinking, students will examine the changing landscapes of their communities over time.
ENGAGE
Understanding the concepts of green space and open space
A. Mental Mapping (Student Resource I)
1. Have students sketch a mental map of the neighborhood around the school, circle three locations that they consider green spaces, and provide a one to two sentence description of each green space including its condition and use.
2. Discussion
Working in small groups, students discuss where and why they located the green spaces on their maps.
B. Challenge 1: Defining Green/Open space (Student Resource II)
- In an effort to develop understanding of green space, engage students in drafting a classroom definition of the term. Begin with students working individually in response to the prompt, located on Student Resource I to compose a personal definition of green space.
- When students have composed a definition individually, come together as a whole class sharing ideas until a consensus definition is reached. Compare with the definition provided below.
Definition:
“Green space (land that is partly or completely covered with grass, trees, shrubs, or other vegetation). Green space includes parks, community gardens, and cemeteries.
Source: http://www3.epa.gov/region1/eco/uep/openspace.html
C. Discussion: Compare/contrast
- Reinforce the concept of green space, the main elements included in a definition, and why this is important to communities. Discuss the concept of open space.
For more information seehttp://www3.epa.gov/region1/eco/uep/openspace.html]
Or use this approach for comparison:
- Working in small groups, ask students to locate a definition of open space. Have them compare and contrast this definition with the definition for green space.
- Ask each group to come up with a definition for open space.
- As a class, develop a Venn diagram comparing and contrasting the two concepts.
D. Assessment: Student Resource III:
- Provide students with visuals or a list of the following features and ask students to identify whether each is an open space, green space or both; streets, car park, forest, parks, community garden, basketball court, baseball field, football field, etc.
E. Evaluation
- Assign a score base on the number of keywords used in the personal definition. Key words include but are not limited; open, land, shrubs, trees, grass, greenery, hedges, parks and gardens.
Challenge 2: How are population patterns are changing in the United States?
By looking at US Census maps, students will be able to list how city populations are changing. Begin by having students compare and contrast maps made by the United States Census Bureau of population by country for the years 2000 and 2010. Have them work in groups to identify trends in population change for that decade (Student Resource IV).
EXPLORE
Reading Remotely Sensed Images
A. Stump the Class: Student Resource V
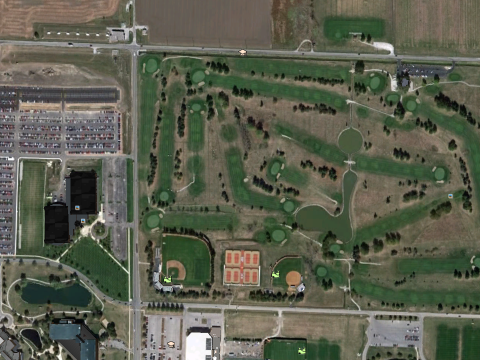
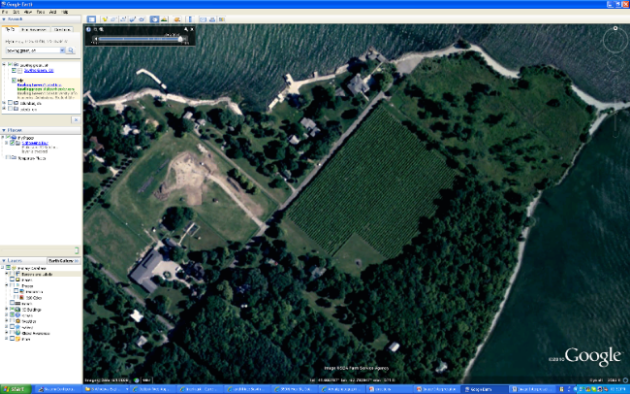
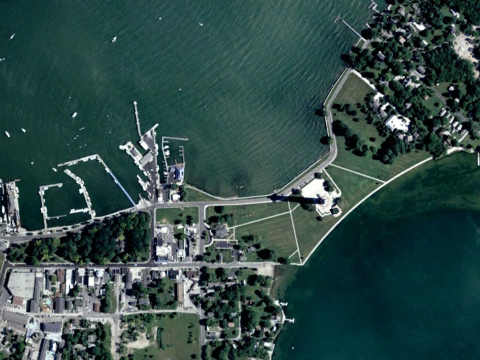
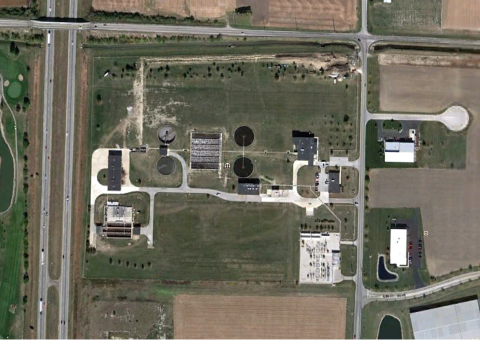
- Select 2 to 4 images, such as those in Appendix A, and engage students in identifying the features on each image. Each student, using Student Resource V should list three guesses for each image
- Discuss the guesses made by students and their reasons for these.
A good source for images is the Google Earth application (https://www.google.com/earth/explore/products/desktop.html) where you can access images for different years.
B. Challenge 3: Using Remotely Sensed Images to Explore a Place (Student Resource VI)
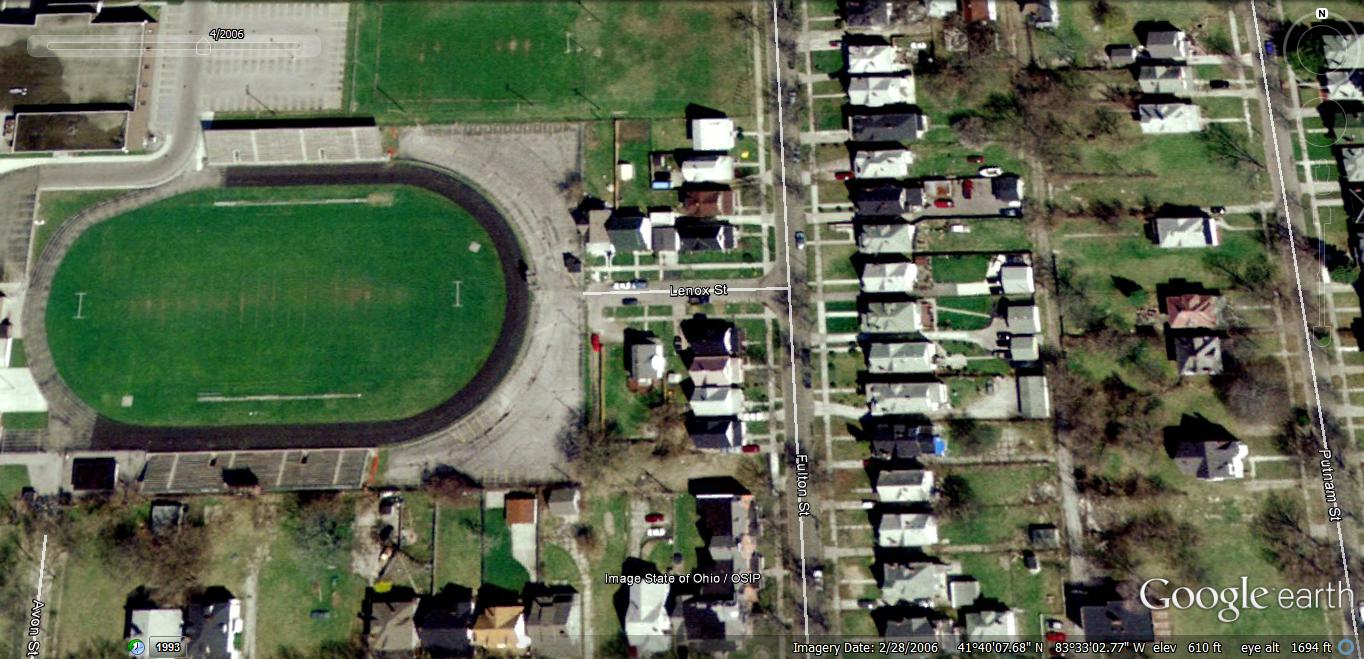
Provide students with a current (RSI One) and a historical (RSI Two) remotely sensed image of the same neighborhood and at the same scale. Look for two images that show clearly identifiable change.
You could also use the images for a neighborhood in Toledo, OH which is provided in Appendix B.
In small groups, students review remote sensed images and complete the tasks on Student Resource VI:
- Describe RSI One then RSI Two
- Estimate the proportion of each image allocated to the open spaces, buildings, roads, water, and other.
- Explain how the estimates were determined.
- Identify the observed changes between RSI One and RSI Two, both numerically and qualitatively.
Using analysis and responses to 1-4 above, as a class:
- List the observed changes in the green/open spaces between the current and older image.
- Describe causes of each change. Students may conduct internet search in finding secondary data.
- Evaluate changes describing positive/negative impacts on the neighborhood.
- Compare differences/similarities between the mental map (A above) with RSI One.
- Explain the comparison supported student understanding/thinking.
Or use this extension (time-permitting):
Student Resource VII: Using field work to verify remotely sensed images
Organize students to walk around the neighborhood in their groups with the current map in hand. If the area is large, assign groups to different sections of the neighborhood. Students will do the following:
- Check the accuracy of the map, making updates to reflect any changes.
- Present your observations to the rest of the class.
C. Assessment Student Resource VIII
1. Students should list five things that should be on a map e.g. title, scale, legend, streets, school, buildings, green spaces
D. Evaluation
1. For Mental maps, assign same score for all maps drawn.
Give extra points for each of the following features if shown on the mental map. Examples include title, scale, legend, streets, school, buildings, green spaces, etc.
EXPLAIN
A. Human activities and their impact on Environment: Student Resource IX
Students are to identify any human activity that can cause changes in green space in the neighborhood, over time. Have students illustrate using charts, how the selected activity affects green space in the neighborhood of the school.
B. Putting observations into perspective through data analysis: Student Resource X
There are several options for data acquisition and analysis. First, student could search for related data, such as median income, per capita income, population, zoning and housing statistics. Potential sources might include the local and county databases, decennial census, the American Community Survey, or the Population Reference Bureau. (Note: when possible, try to get data as close as possible in time to the historic and contemporary maps provided in Steps 1 and 2.) The task for each group is to:
- Compare the data sets and identify changes that would impact community land use.
- Determine whether the data set represents changes related to “population,” “affluence,” or “technology”. Explain your supposition.
- Assess the impact the changes would have on the neighborhood, using data to support the assessment.
- Propose questions that remain or that came up as a result of this activity.
C. Assessment: Student Resource XI
Ask students to list three sources of secondary data and give an example of data that can be found in each of these sources.
D. Evaluation
- Assign a score for each human activity identified by students and an additional score for the illustrations made. For each data and data source, assign additional scores.
APPLY
A. Challenge 4: Connecting Research to Neighborhood Change (Student Resource XII)
Students are to imagine that they have been asked to serve as a liaison between neighborhood residents and the city’s planning department. Their task is to determine how the green space in the neighborhood has been used in the past, how it used currently, and create a proposal for future use of one location. Questions students can address include:
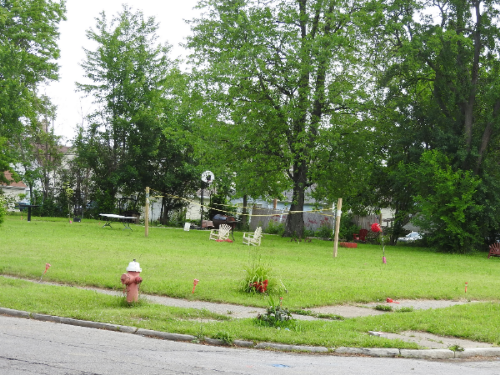
- Where applicable, what persistent problems need to be addressed (i.e., abandoned buildings and lots that are not being maintained)
- How do you suggest addressing the problems?
- Who are the other individuals and agencies who will be involved in solving the problems identified?
- Create a PowerPoint presentation to provide concrete suggestions to the planning department of your city.
B. Assessment: Student Resource XIII
- Ask students to identify two roles of a city planner
- Students should write in two or three sentence the process involved in identifying challenges in their community.
C. Evaluation
For each problem identified, assign a score and an additional score if students explain the problem. Assign a score for each solution proposed by students and individuals/agencies identified. Give extra points for well-organized PowerPoint presentation.
CONNECTIONS
Real World Experience
A. In communities with present or persistent land use challenges, students might assume the roles of different community stakeholders to investigate the use of green space in the neighborhood in regards a specific challenge. They would consult historical maps to understand past use, the current challenge, and assess the proposed changes in use, and/or make proposals for the future (Student Resource XIV).
Students should list the main stakeholders in the development of their city research each one's role.
- Planning Commission
- Elected officials
- Concerned neighborhood homeowners
- Students
- Owners of affected properties, including homeowners, business owners, and institutions like religious organizations
B. Assessment: Student Resource XV
Students should list the main stakeholders in the development of their city.
C. Evaluation
Assign score for creative thinking and feasibility of proposals.
EXTEND
This could be a project for honor’s students that links to the standard HS-LS2-7.
Design, evaluate, and refine a solution for reducing the impacts of human activities on the environment and biodiversity. The focus can be determined by the teacher and student based on the student's interests.
ADDITIONAL RESOURCES
- Definition of green space and open space http://www3.epa.gov/region1/eco/uep/openspace.html
- Census Data from http://www.census.gov/
- American Community Survey http://www.census.gov/programs-surveys/acs/
- Google Earth application downloadable at https://www.google.com/earth/download/ge/agree.html
- For more Remote Sensing game, http://americaview.org/remote-sensing-memory-game.html
- For video on urbanization and geospatial technology, use Geospatial Revolution Video. Episode 2: Chapter 1, Creating an Interactive City (6 minutes) http://www.youtube.com/watch?v=otpDq8CAano
student resources
All of these worksheets are described and linked in the module above also.
Student Resource I - Defining Green Space
Student Resource II - Challenge 1
Student Resource III - Differentiating Open and Green Space
Student Resource IV - Challenge 2
Student Resource V - Stump the Class Remote Sensing
Student Resource VI - Challenge 3
Student Resource VII - Fieldwork and Remote Sensing
Student Resource VIII - Features of a Good Map
Student Resource IX - Human Impact on the Environment
Student Resource X - Observations and Data Analysis
Student Resource XI - Identifying Data Sources
Student Resource XII - Challenge 4
Student Resource XIII - Connections to Careers
Student Resource XIV - Real World Experience
Student Resource XV - Assessment
REFERENCES
Population Data Sheet 2015
Us census bureau, 2010 census
http://www3.epa.gov/region1/eco/uep/openspace.html
Google Earth
Next Generation of Science Standard
College, Career, and Civic Life Standards
National Geography Standards
Appendix A
APPENDIX B
Current and Historical Remotely Sensed Image of the Scott High School Neighborhood, Toledo, OH
How to retrieve Remotely Sensed Images Using Google Earth:
Assuming Google Earth is available on the computer, enter the address of the school. [If not, this is a free program that can be downloaded.]
For our example: 2400 Collingwood Blvd., Toledo, OH
In the menu above the map, select the icon with the clock that notes “Show Historical Imagery.”
A timeline will appear in the upper left hand corner of the map that indicates how far back Google Earth has images. Starting from the far left, click on the right arrow to proceed through the images.
For our example, the following images are available:
- 1993, 2000, March 2003 (all B/W)
- November 2003 and September 2004 (somewhat color)
- December 2004 (color)
- February 2005 (snow)
- August 2005 (color)
- April 2006 (color and clear image)
- July 2006 (color)
- October 2006 (color, fuzzy)
- August 2009 (color)
- October 2010 (color)
- December 2010 (color)
- November 2011 (color)
- May 2014 (color and clear)
Depending on how many images you want students to compare, select the years for comparison in advance.
Some considerations in choosing images:
- Are the images in color or black and white? Which do you prefer for your purposes?
- At what time of the year were the images taken? In spring, summer, fall, or winter? If you are going to compare two images, you might want them to be from the same season? Or perhaps it would work better to have less tree cover?
- Are the dates and images accurate? In other words, are they labeled accurately in Google Earth?
For our example, we have students compare images for April 2006 and May 2014.
Historical Image, April 2006
Current Image, May 2014
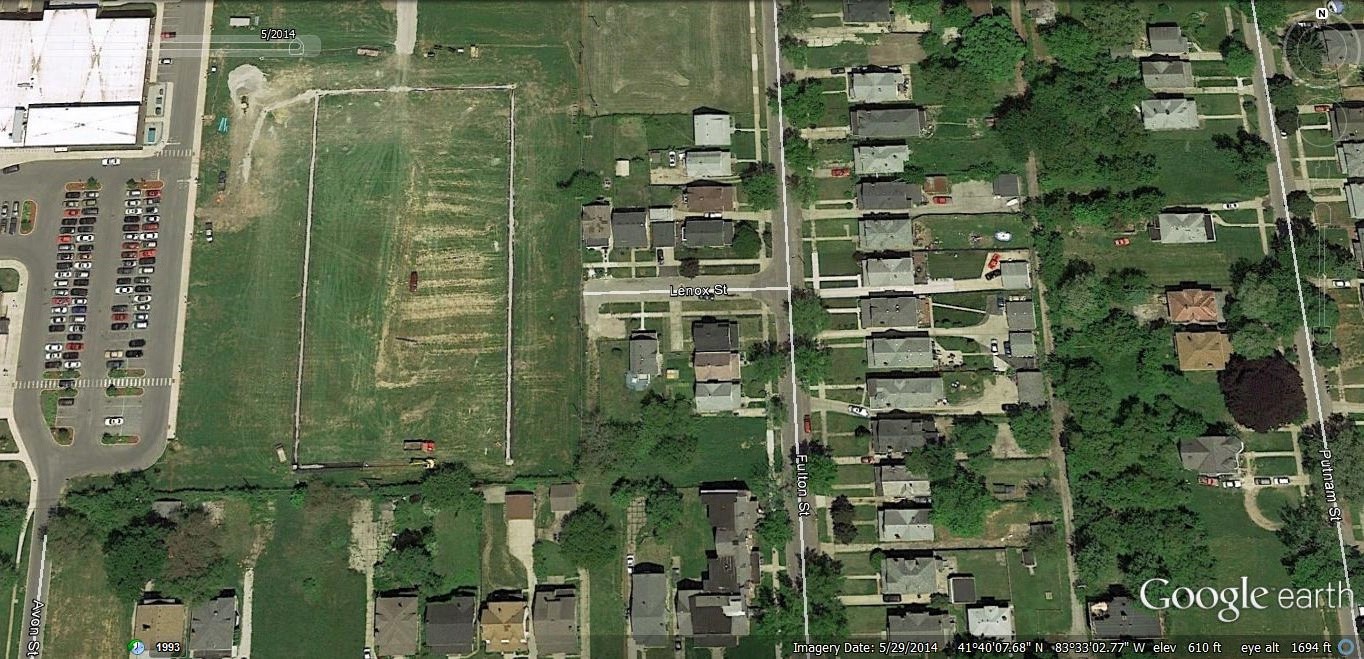
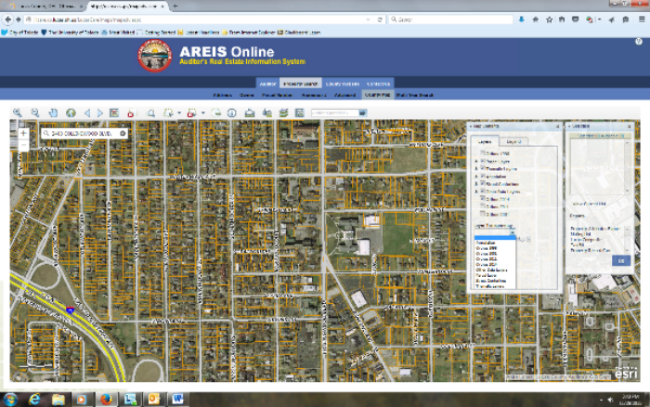
2. Using a County Level GIS Database:
AREIS On-line (Auditor’s Real Estate Information System for Lucas County, Ohio)
Access:
http://icare.co.lucas.oh.us/LucasCare/maps/mapadv.aspx
Enter address of School: 2400 Collingwood Blvd.
Zoom in or out to desired view.
Select Map Contents from menu above map.
Choose year from Layers and Layers Transparency (turn off and on year of choice).
Example of 2014 Map from AREIS Online, which includes images dating back to 1998.
