

Youth Employment Module
Experiential Learning Module:

Youth Employment Opportunities in the Community
BIG QUESTION
How do we connect youth with job opportunities in the neighborhood?
OVERVIEW
One of the long-standing challenges families and communities have faced is how to keep young people busy and engaged when they are not in school. The responses to this have largely fallen in two categories, jobs and recreation. Particularly for youth in the 14-18 age group, the challenge has been to find sources of teen employment within the community, and convenient places within the community where they can safely gather and/or play.
In this module, we focus on employment. To increase their understanding of and engagement with issues surrounding youth employment, students will examine their communities using a place-based inquiry learning approach. They will learn to extrapolate and interpret information from remotely sensed images of their neighborhood by comparing historical and contemporary images and then validating these images through field work, where possible. They will examine secondary data to add context, and evaluate land use options to make informed recommendations about increasing job opportunities for youth the community.
Content focus: EarthScience, Geography, People-Environment, Population
Skill focus: Map Interpretation, Remote Sensing, Fieldwork and Observation, Data Analysis
Level of Inquiry: 1-3 (Confirmation, Structured, Guided)
Key Concepts: Environmental impact, urbanization, urban planning, retail businesses, local business, remote sensing
STANDARDS
Focus Standards
When evaluating solutions it is important to take into account a range of constraints including cost, safety, reliability and aesthetics and to consider social, cultural and environmental impacts.
The processes, patterns and functions of human settlement
The student knows and understands:
Functions of Settlements:
The numbers, types and range of the functions of settlements change over space and time. Therefore, the student is able to:
Explain how and why the number and range of functions of settlements have changed and may change in the future, as exemplified by being able to
Analyze the reasons for and results of policies of municipal governments on the internal structure of cities (e.g., zoning ordinances to determine the location and characteristics of residential, commercial, and industrial sectors, incentives to encourage development, legislation of flood-plain regions restricting development).
Prior Standards: Anticipated Prior Knowledge
Next Generation Science Standards
MS-ETS1-3. Analyze data from tests to determine similarities and differences among several design solutions to identify the best characteristics of each that can be combined into a new solution to better meet the criteria for success.
College, Career, and Civic Life: Geography standards
D2.Geo.2.9-12. Use maps, satellite images, photographs, and other representations to explain relationships between the locations of places and regions and their political, cultural, and economic dynamics.
D2.Geo.1.9-12. Use geospatial and related technologies to create maps to display and explain the spatial patterns of cultural and environmental characteristics.
D4.5.9-12: Critique the use of the reasoning, sequencing and supporting details of explanations
College, Career, and Civic Life: general standards supporting geographic thinking
Economic Decision Making
D2.Eco.1.9-12. Analyze how incentives influence choices that may result in policies
with a range of costs and benefits for different groups.
LEARNING TARGETS
By the end of this module students will be able to make recommendations for increasing opportunities for youth employment in the community. They will learn to read and compare remotely sensed images, use field work where appropriate to ground-truth these images, use secondary data to learn about the community, and build on their research by identifying sites and proposing land uses that could support increased youth employment opportunities in the community.
Given the importance of young people to future of a region, this module creates opportunities for youth to reflect on the needs of the community and help develop proposals that could meet their needs, in this case economic needs, in the particular context of their community. The context includes both the physical, for example, the availability of land or buildings that can be used to create jobs for youth, and the social, for example, neighborhood organizations that could be involved in developing job opportunities for youth.
Background
One of the ways by which we measure the extent to which people have work is through the unemployment rate. As seen in Map 1, there is great variation in the unemployment rate across the country.
Map 1: Unemployment rates by county, 2015 annual averages

Source: Bureau of Labor Statistics
Opportunities for youth employment within the community can help get youth involved in and strengthen their connections to the neighborhood. However, there are many neighborhoods in the country that do not have appropriate job opportunities for youth, nor spaces and institutions that can support youth employment. Young people living in these neighborhoods often have to travel outside their community by walking, biking, driving or using public transportation to get to summer jobs or part-time jobs during the school year.
ENGAGEUnderstanding elements of community-based jobs for youth.
A. Find answers collectively to a framing question: Group Activity
You, the teacher, can decide the area around the school on which you want to concentrate. We suggest a four block or quarter mile radius around the school, but you may want to enlarge this radius if there are not many job opportunities close to school. Include volunteer work also as an option.
Write down the questions so the class can see them. Students call out the answers to the first question and you can write them down so the class can see the list of answers.
Once the list seems complete, have students answer the Question 2: "Are there different kinds of jobs? If so, how are they different?" For example, formal (working in a store) vs. informal (mowing lawns); working for a company vs. working for an individual; involves some training vs. they can start right away, jobs within walking distance vs. jobs further away, and so on.
B. Defining what makes a job attractive: Individual-Student Resource I; Group - Student Resource II
1. Begin with students working individually in response to the prompt. Using Student Resource I have students write down words that describe what makes a job attractive for each of them.
- What are the jobs that may meet all or many of the characteristics listed earlier (in Student Resource II)?
- Can you find these jobs close to school?
- Is there another neighborhood that has more or fewer of these kinds of jobs?
Or use the Challenge below:
- Working in small groups, ask students to identify a local job opportunity and describe its characteristics (no training needed, flexible, easy to get to, poor pay, etc.).
- Have them discuss whether they would consider this a good job for a young person in their high school? Why or why not?
- Prompt them to think about the actors and institutions in the community associated with finding and keeping that job, such as local business owners, a teen summer employment program run by the city, the school counsellors, local faith organizations, the organizers of job/career fairs, etc.
D. Evaluation
- Assign a score base on the number of keywords used in the personal definition. Key words may include but are not limited; accessible, friendly environment, keeps me busy, convenient, good hours, safe.
EXPLORE
Mental maps and Reading Remotely Sensed Images
A. Mental Mapping: Individual, Student Resource IV

Source: http://groups.ischool.berkeley.edu/mentalmaps/
1, 2. Using Student Resource IV, have students sketch a mental map of the neighborhood around the school, circling the locations that they consider have suitable job opportunities for youth, and providing a one to two sentence description of each location and type of job. For example, for location, students may say, it faces a busy road, or it is next to an abandoned house, or it is in the middle of a busy strip mall, etc.
(We will use the maps as comparison with remotely sensed images and commercial maps later.)
3. Group
Have students work in small groups to compare the similarities and differences in their mental maps and then report out.
B. Comparing mental maps and remotely sensed images: Individual and Student Resource V: Group
Provide students with visuals or a list of possible jobs for youth. You could come up with this list or use the list developed by students in Student Resource IV. If developing the list yourself, examples of jobs would include you could include babysitting, snow shoveling, lawn mowing, working at fast food establishments, retail establishments, and so on.
Also, provide an aerial map of a quarter mile (or 4 blocks), around the school, remotely
sensed image 1, or RS1. A good source for images is the Google Earth application  or Google Maps application
  where you can access images for different neighborhoods.
1. Working individually, ask students to identify where on their mental map these jobs might be located. Then have them do the same thing on the Google map.
2. Discussion
Using Student Resource V, working in small groups, have students discuss similarities and differences between their mental map and aerial image, each with possible job locations marked and report out.
IF YOUR SCHOOL IS IN A NEIGHBORHOOD WHERE THERE ARE NOT MANY EMPLOYMENT OPPORTUNITIES CLOSE BY, INSTEAD OF b YOU CAN DO c BELOW.
C. Using Remotely Sensed Images to Explore a Place: Student Resource VI
Provide students with two remotely sensed images, RS2 and RS3 of two different neighborhoods at the same scale. Have students work in small groups and note the differences and similarities in the neighborhoods. A good source for images is the Google Earth or Google Map application (https://www.google.com/earth/explore/products/desktop.html) where you can access images for different neighborhoods.
You could also use the images for a neighborhood in Toledo, OH and Chicago, IL which is provided in Student Resource VI.
In small groups, students review remote sensed images and complete the tasks on Student Resource VI:
- Describe RS2 then RS3
- Estimate the number of locations for jobs you can identify in RS2 and RS3.
- Explain how you reached this estimate.
- List the differences you see between RS2 and RS3.
Using analysis and responses to 1-4 above, as a class:
- List the observed differences between images for RS2 and RS3 as students call them out.
- Think about why these differences exist.
Challenge:
Student Resource VII: Using field work to verify remotely sensed images
Find an easily accessible, and walkable neighborhood and provide students with a map of the neighborhood from Google Earth/Google maps. Organize students to walk around the neighborhood in their groups with the current map in hand. If the area is large, assign groups to different sections of the neighborhood. Students are to;
- Check the accuracy of the remote sensing map, making updates to reflect any changes.
- Present your observations to the rest of the class.
D. Assessment: Student Resource
1. Students should list five things that should be on a map e.g. title, scale, legend, streets, school, buildings, green spaces
E. Evaluation
1. For mental maps, assign score for the number of job locations and descriptions shown.
2. Assign points for all the differences students identified between the mental map and RS1, (or between RS1 and RS2) and the process they used to estimate the number of jobs.
3. Assign points for the various features (up to five) that should be on a map
For the challenge:
4. Assign points for carefulness of observation and recording of differences between what exists and what is on the map. (Do not assign points on the number of changes noted as some sections of the map might be quite accurate and not need much updating.)
EXPLAIN
- Explaining the youth employment and community context through data: Student Resource VIII
A. Census data for the community and the state
Students look at the census data for their city/community and compare what they see
to state or national averages. ![]() , enter name of place and state
, enter name of place and state
B. Putting observations into perspective through comparative analysis: Student Resource IX
Students search for data related to the broader community and youth employment, such as median income, per capita income, population, percentage of each age group, zoning, etc. They do this for two cities. Potential sources for data might include the local and county databases, decennial census, the American Community Survey, or the Population Reference Bureau. Using Student Resource IX students work in groups to:
- Compare data for two places and identify the differences
- Assess the impact the differences would have on the job opportunities, using data to support the assessment.
C. Assessment: Student Resource X
Ask students to list secondary data sources they used and give an example of data that can be found in the sources listed. (Example: Census, Google, News Channels etc)
D. Evaluation
- Assign a score for each source of secondary data listed and the data that students are able to get from that source. Assign additional scores for the questions/comments they ask.
IV. APPLY
Connecting research to youth employment opportunities in neighborhood: Student Resource XI
A. Students are to imagine that they have been asked to serve as a liaison between students, employers and city officials. Their task is to determine the factors, skills and concerns pertaining to obtaining a job (part time or full time), and create a proposal for future use of one location.
- What are the barriers to finding a job? (Location of jobs, skills, transportation, etc.)
- How do you suggest addressing the problems? (Job fairs, connecting employers to high school students seeking jobs, job training, etc.)
- Create a PowerPoint presentation to provide concrete suggestions to your city's planning department or mayor.
B. Assessment: Student Resource XII
- Ask students to work in groups to pick two sites within their neighborhood and propose uses for those sites that will provide youth employment. Provide them with an appropriate map,
- Students should describe, in bullet points, why they picked that particular site and use.
C. Evaluation
Assign a score for each suggestion proposed by students in their presentation. Give extra points for a well-organized PowerPoint presentation.
For each point that the students identify for why they picked a particular site and use, assign a score.
V. CONNECTIONS
Real World Experience:
In communities where youth face persistent challenges finding jobs, students might assume the roles of different community stakeholders to investigate the history of their particular neighborhood. Students can consult historical maps to understand past use, or conduct archival research, (such as reading old newspaper articles), to understand the history behind current challenges. For example, the political/civic leaders group may look at how politics have evolved in the community over time. The business owners group may look at how businesses have changed along the main streets and why.
B. Assessment: Student Resource XIII
Students should list the main stakeholders in the development of their city and provide a one sentence description of what each can do to increase youth job opportunities. For example,
- Planning Commission
- Elected officials
- Concerned neighborhood homeowners
- College students
- School students in the neighborhood
- Owners of affected properties, including homeowners, business owners and institutions like religious organizations
- Local businesses
C. Evaluation
Assign scores based on what they find out about the history of the community. Assign scores the stakeholders and roles they identify.
EXTEND
What ideas do you have to make it easier for youth to find jobs in the neighborhood?
As a class, write down a set of ideas that she can implement in the short term (4-6 months), and think about for the long term (4-5 years).
STUDENT RESOURCES:
- Student Resource I : Factors that make job attractive (Individual)
- Student Resource II : Factors that make job attractive (Group)
- Student Resource III : Job characteristics
- Student Resource IV : Mental Mapping
- Student Resource V : Comparing mental maps and remotely sensed images
- Student Resource VI : Using Remotely Sensed Images to Explore a Place
- Student Resource VII : Field work to verify remotely sensed images
- Student Resource VIII : Explain youth employment and community
- Student Resource IX : Comparative analysis
- Student Resource X : Assessing the impact
- Student Resource XI : Connecting research to youth employment opportunities
- Student Resource XII : Assessment of empty site
- Student Resource XIII: To list main Stakeholders
- Student Resource XIV: Planning commission
ADDITIONAL RESOURCES:
- Census Data for city of Chicago : https://factfinder.census.gov/faces/nav/jsf/pages/community_facts.xhtml
- American Community Survey http://www.census.gov/programs-surveys/acs/
- Google Earth application downloadable at https://www.google.com/earth/download/ge/agree.html
- Google Maps: https://www.google.com/maps/
- Resume writing: https://owl.english.purdue.edu/owl/resource/719/1/
REFERENCES
APPENDIX
RS1 – Image 2

Google Earth/Google Maps image: A suburban school in Schaumburg, IL (Schaumburg High School)
RS2 – Image 3

Google Earth/Google Maps image: ASHE school – Downtown Chicago
Image 4 – To look for opportunities within a given radius
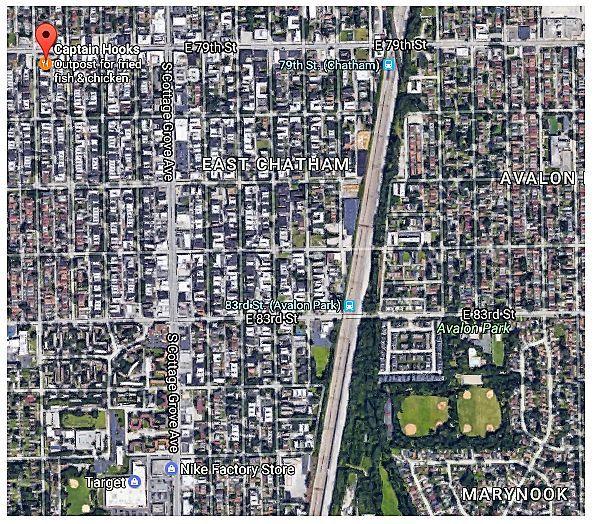
https://www.google.com/maps : restaurants in >0.5 miles from 60619
Table:
|
Item |
URL |
Purpose |
|
Mapping |
Google earth, google maps is a virtual tool for visualizing different neighborhoods for primary and secondary data collection. |
|
|
Mapping |
Google earth, google maps is a virtual tool for visualizing different neighborhoods for primary and secondary data collection. |
|
|
Data |
https://factfinder.census.gov/faces/nav/jsf/pages/index.xhtml# |
American Fact finder to compare and find information on demographic data |
