Crime Module
Experiential Learning Module:
What Does Crime Look Like in My Neighborhood?
Big Questions

- What is crime, who does it impact, and where does it occur?
- What are the different crimes impacting my community?
- How does crime compare across communities?
overview
Every community has crime. Contrary to common beliefs, crime occurs everywhere, it is the type and occurrence of crimes that vary. This module focuses on defining crime, determining what accounts for crime, and comparing crimes across scales (i.e., local, county, state, etc.). Understanding crime and its impact on both individuals and the community are important first steps for addressing it in communities. Additionally, students will consider how political and economic decisions can impact a location and will be challenged to consider how their perceptions and understanding of crime in a location may be different than the reality.
Content Focus: Political science, civics, geography, economics
Skill Focus: Reading, analyzing and interpreting geographic representations of data
Level of Inquiry: Level 1-Teacher Guided
Standards
FOCUS STANDARDS
National Geography Standard 3
How to analyze the spatial organization of people, places, and environments on Earth's surface
Spatial Models
3. Models are used to represent features of human and/or physical systems
Therefore, the student is able to:
A. Describe and construct models illustrating the properties of human and/or physical
systems, as exemplified by being able to construct a model of the community and identify
the different land uses (e.g., residential, industrial, retail).
Source: Geography for Life: National Geography Standards, Second Edition (Heffron and Downs 2012, 34).
National Geography Standard 18
How to apply geography to interpret the present and plan for the future
Perceptions of Geographic Concepts
Therefore, the student is able to:
A. Explain how people’s perceptions of the world can change with new information and
new experiences, as exemplified by being able to describe and explain how a student’s
view of his or her home community can be different from someone who is only visiting
the community.
Source: Geography for Life: National Geography Standards, Second Edition (Heffron and Downs 2012, 93)
College Career and Civic Life (C3) Standards
D2.Geo.3.9-12. Use geo- graphic data to analyze variations in the spatial patterns of cultural and environmental characteristics at multiple scales.
Prior standards
D2.Geo.3.6-8. Use paper based and electronic mapping and graphing techniques to represent and analyze spatial patterns of different environmental and cultural characteristics.
LEARNING TARGETS
By the end of this module students will be able to…
- State and describe different types of crime.
- Identify and compare crime statistics across local, state, and national levels.
- Construct and communicate an argument using evidence to support their claims.
BACKGROUND
This module emanated from work with high school students engaged in two summer workshops. The students elected to investigate crime in their neighborhood, which was reported to have a crime rate per square mile (n=217) six times higher than the national rate (32.8), with violent crimes occurring at a rate of 10.93/1000 people compare to 3.8/1000 nationally (https://www.neighborhoodscout.com/oh/toledo/crime/, n.d.) During their investigation, students identified shared and personal misconceptions related to crime, both related to the types and occurrence of crimes in various locations in the community. Examples of their false impressions included believing crime was more prevalent in one area of the community compared to others, that high crime areas were easily identifiable, and areas with lower crime rates would also have a comparatively older population. Through this investigation students will identify and analyze data, consider crimes across a variety of scales, local state, and national, and develop conclusions to their recognize misconceptions related to crime.
ENGAGE
What is crime?
Brainstorming Activity 1
To provide all students an opportunity to participate, begin with individual brainstorming, then lead a group sharing, developing lists on a shared space (e.g., white board, flip-chart, etc.). Students will brainstorm responses to the following prompts.
ASK students:
What is crime? How do you define the word “crime?” What are examples of crimes?
At this phase the teacher should not respond to guide or provide correct responses. When all possible answers from students are exhausted, move on to part II Explore activity two.
EXPLORE
Activity 2 Case Studies: Six mini-case studies are provided (see Activity 2 student resources) to introduce students to types of crime, the concepts of crime (victimless, property, etc.) and engage students in thinking about and developing questions related to crime. The purpose is to determine students’ ability to identify and describe crimes, including those considered “victimless.” Students will use Resource 1 with this activity. After students complete the activity, discuss their responses asking students. Use questioning strategies to scaffold abilities to articulate their interpretations and clarification of their responses to promote use of prior knowledge, evidence from the case and to clarify their thinking. Possible question stems are provided to support higher-order thinking. The list is not exhaustive:
- Why did you classify that as a crime? (Or, why did you not classify that as a crime?)
- What specific elements of the case (or prior knowledge) led you to that conclusion? (Or, how did you come to your conclusion?)
- Why do you think so?
- What alternative evidence might you provide?
After students have shared their ideas, share the correct answers if needed [suggested answers are presented at the end of Resource 1].
Engage students in discussion related to their answers. Students should be asked to categorize the criminal acts using the table provided on resource 1. There may be the misconception that the examples are not criminal acts, but are ethical/moral concerns. Check state and local laws, but each example has been defined as criminal in most states.
Next, students will locate definitions related to the content. You may use the websites below to identify definitions and examples of crimes.
Bureau of Justice Statistics: https://www.bjs.gov/index.cfm?ty=tdtp&tid=3
Federal Bureau of Investigation https://www.fbi.gov (students will use the search function provided on the website)
Discuss and define:
Using the Uniform Crime Reporting (UCR) website (see link below), students will select their home state and two or three other states and choose from violent and/or property crime rates for the same year for comparison. They will answer the following questions:
- State the crime rates for each state.
- Explain why one state has higher violent/property crime rate than the other?
- What data can help you investigate the above trend?
- Explain what you and your family can do to reduce the possibility of becoming a victim to violent and property crimes.
Alternatively,
Students can select one state and compare changes that have occurred over the years in one crime category.
In either situation, students will investigate the conditions or events that may have impacted crime.
Uniform Crime Reporting (UCR) https://www.ucrdatatool.gov/Search/Crime/State/StatebyState.cfm?NoVariables=Y&CFID=144010027&CFTOKEN=c2ecf9e4b5336525-368A1505-9A52-C776-0393EAB0C60AF19B
EXPLAIN
Students should begin to recognize that crime is multi-faceted, occurring everywhere to different degrees. Given the complexity related to crime as a topic, it is helpful for students to begin to confront crime that is relevant to their communities, addressing their perceptions and misconceptions. In addition to misconceptions above, common misconceptions include ideas such as; crime being consigned to certain areas or locations (the “bad parts of town”) or crime is consistently getting worse over time. Further, for those who have not been directly impacted by crime, there may be a misconception is that crime only has an impact on the individual. However, crime impacts the community in multiple ways. Negative impacts include decreased community cohesion and housing values. Alternatively, positive effects may actually be an increase in community cohesion, as citizens come together, organizing grassroots campaigns to address crime. Content and activities that follow address crime misconceptions and across local, state, and national levels.
Activity 4: Crime Rates in the US.
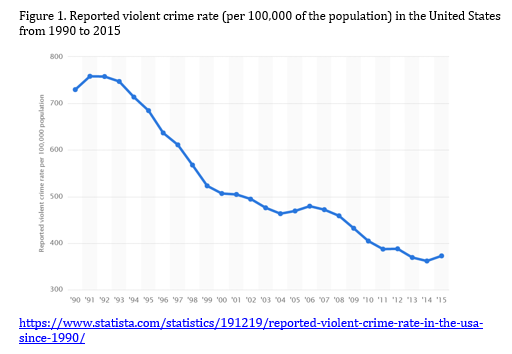
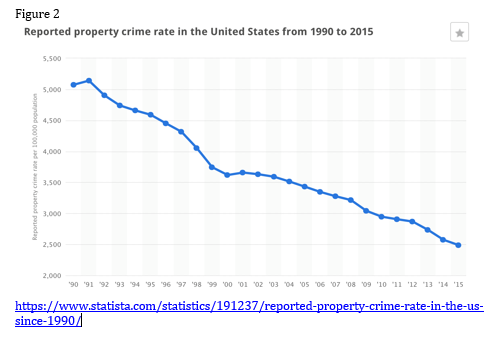
Prior to showing students the graphas below, ask them to use thumbs-up to answer True, or thumbs-down to answer False, to the following statements (each is false) and tally votes.
Provide students access to each of the following graphs either as a class or individally (Graphs as a Worksheet). Interactive graphs are available through Statista.com (see links beneath graphs). They will complete Activity 4: Changes in Rates resources sheet.
Source: https://www.statista.com/statistics/191219/reported-violent-crime-rate-in-the-usa-since-1990/
Source: https://www.statista.com/statistics/191237/reported-property-crime-rate-in-the-us-since-1990/
APPLY
Begin to make connections to the local community. Provide students with a map of the area surrounding the community or local area. Ask students to identify: 1) types of crimes they are aware of in the school community and 2) where the crimes occur. [Maps may be accessed through Google Maps, or similar sites.]
Some teachers may need to modify this activity, and direct students to a larger area, such as a nearby city, county, or state. In this case, the mapping exercise may not apply and students would be asked to respond in more general terms.
Collaborate
When students have completed this activity, ask them to share, creating a master list in another location visible to all students using the following titles or similar.
|
Type of Crime |
Location |
|
Ex: breaking into a car Robbing a party store |
Ex: school parking lot Corner of Franklin and Main St |
Ask students to review the lists and identify examples that they do not agree are crimes and briefly explain why. Make notations on the lists to indicate differences of opinion across the class. For activity 3, group students according to their interests.
Activity 5: Investigating Crime in the Community
Small groups will apply what they have learned to investigate crime in communities (see Activity 5 in student resources). Students will
1) Create lists of everything they know as a group about their crime topic.
2) Determine if the crimes that they identify are violent, property, personal, hate or some other crime using definitions above.
3) Using their lists from step 1, students will conduct an internet search of their topic, seeking relevant information directly related to their interests. For example, where do crimes occur in the community? What types of and at what rate? What deterrents to crimes are there in the community?
4) Students will plot their findings, developing crime maps using ArcGIS online (https://www.arcgis.com/home/index.html ), IMap Builder or similar mapping software (https://www.imapbuilder.net )
5) Students will compare their crime maps to those developed by other groups, discussing and comparing locations, decisions related to what to include and exclude, and how crime is represented visually.
6) Students will analyze their maps/information and determine how they can account for differences in their original ideas of crime and locations in the local area compared to data from their search and the lesson.
Sources that may be helpful for students investigating crime at the local level include local media (newspaper or television), as they publish crime watch special interest information, or sites such as NeighborhoodScout.com (https://www.neighborhoodscout.com/ ) providing information related to real estate. Larger cities and their police departments may also provide crime data and maps, for an example visit the City of Toledo Police Department crime map, accessible through: http://crimemap.toledo.oh.gov
Other possible resources include:
School Level Data
National Center for Education Statistics: Fast Facts: School Crime
https://nces.ed.gov/fastfacts/display.asp?id=49
City Level Data
Neighborhood Scout. Neighborhood Crime Rates. (Accessed October 1, 2016)
https://www.neighborhoodscout.com/oh/toledo/cherry-st/#crime
County Level Data
Population of Health Institute, County Health Rankings & Roadmap: Violent crime rate.
http://www.countyhealthrankings.org/measure/violent-crime-rate
Uniform Crime Reporting Program Data: County-Level Detailed Arrest and Offense Data,
http://www.icpsr.umich.edu/icpsrweb/NACJD/studies/35019
State Level Data
Bureau of Justice Statistics, .Spreadsheets, https://www.bjs.gov/content/dtdata.cfm
Federal Bureau of Investigation, Crime in the U.S. 2015, https://ucr.fbi.gov/crime-in-the-u.s/2015/crime-in-the-u.s.-2015
CONNECTIONS
To support connections beyond the classrooms, introduce students to careers that use geographic/geospatial technology skills. Students will view the following video
https://youtu.be/wOfZI6yPrjo, and then conduct an internet search investigating career paths requiring geography/GIS skills that are related to criminal justice. To share what they have learned, each group will develop a Public Service Announcement (PSA) indicating how the position relates to the work content they learned about in this lesson, to promote awareness of a career path in geography/GIS related to criminal justice. The PSA should provide information about how the career path is important in reducing crime and/or maintaining order and security in communities.
Begin by showing the following PSA and discuss the attributes of the PSA.
No Illegal Downloading: access through https://youtu.be/8h0YFASOAvQ
If more support is required to scaffold student understanding of a PSA, visit Scholastica Lesson Plan: Listen Carefully, accessible through http://www.scholastic.com/listencarefully/pdf/Listen_Carefully_Storyboard.pdf and use the suggested lesson elements as needed.
The PSA may be assessed using the following rubric:
ReadWriteThink PSA Rubric: http://www.readwritethink.org/files/resources/lesson_images/lesson939/psa-rubric.pdf
EXTEND
“What’s next?”
To support individual agency and sense of ownership over content/skill, students will develop a map of an imaginary “safe” neighborhood taking into consideration roads, residential locations, location of fire stations, police departments, sidewalks, parks, street lights etc. For each location, students will defend their reasoning for the location given its purpose and the overall layout of the community.
RESOURCES & REFERENCES
Campaigning for Fair Use: Public Service Announcements on Copyright Awareness - ReadWriteThink. (n.d.). Retrieved March 04, 2017, from http://www.readwritethink.org/classroom-resources/lesson-plans/campaigning-fair-public-service-939.html?tab=4#tabs
National Archive of Criminal Justice Data, (2016) Uniform Crime Reporting Program Data: County-Level Detailed Arrest and Offense Data, 2012. ICPSR35019-v1. United States Department of Justice. Federal Bureau of Investigation. Ann Arbor, MI: Inter-university Consortium for Political and Social Research [distributor], 2014-06-12. http://doi.org/10.3886/ICPSR35019.v1 Retrieved March 01, 2017, from http://www.icpsr.umich.edu/icpsrweb/NACJD/studies/35019
Neighborhood Search for Home Buyers and Real Estate Investment. (n.d.). Retrieved March 02, 2017, from https://www.neighborhoodscout.com/
Neighborhood Scout. Neighborhood Crime Rates. (Accessed October 1, 2016)
https://www.neighborhoodscout.com/oh/toledo/cherry-st/#crime
No to Illegal Downloading. (2009, September 24). Youtube. Retrieved March 03, 2017, from https://www.youtube.com/watch?v=8h0YFASOAvQ
Uniform Crime Report (2013). Hate Crime Statistics, 2012. Retrieved from https://ucr.fbi.gov/hate-crime/2012/resource-pages/summary/summary_final.pdf
University of Wisconsin, Population of Health Institute (2016). County Health Rankings & Roadmap: Violent crime rate. Retrieved February 24, 2017, from http://www.countyhealthrankings.org/measure/violent-crime-rate
United States Department of Education, National Center for Education Statistics. (n.d.). Fast Facts: School Crime. Retrieved February 20, 2017, from https://nces.ed.gov/fastfacts/display.asp?id=49
United States Department of Justice, Bureau of Justice Statistics, (n.d.) .Spreadsheets. Retrieved February 24, 2017, from https://www.bjs.gov/content/dtdata.cfm
United States Department of Justice, Federal Bureau of Investigation. (2016, May 03). Crime in the U.S. 2015. Retrieved February 24, 2017, from https://ucr.fbi.gov/crime-in-the-u.s/2015/crime-in-the-u.s.-2015


