Experiential Learning Module: Housing and Quality of Life
BIG QUESTIONHow does the condition and availability of housing impact the quality of life in a community?
OVERVIEW Students will explore the connections between economy and housing. They will examine their communities using an inquiry-place-based learning approach to determine the quality and quantity of housing available. A primary focus is to assess the quality of housing by creating a ranking system, and a related challenge is to determine the proportion of abandoned or vacant properties. Students will conduct fieldwork and consult secondary data to address their inquiry questions. Content Focus:Urban Geography, Economic Geography, Health Geography Skill Focus:Map Interpretation, Classification, Fieldwork and Observation, Data Analysis Key Concepts:Quality of Life, Housing, Urbanization, Urban planning, Health Grade Level:9th to 12th grades Duration for Lesson:3 to 5 days
|
STANDARDS
Focus Standards
Next Generation Science Standards
HS-ETS1-3. Evaluate a solution to a complex real-world problem based on prioritized criteria and trade-offs that account for a range of constraints, including cost, safety, reliability, and aesthetics, as well as possible social, cultural, and environmental impacts.
Disciplinary Core Ideas
Criteria and constraints also include satisfying any requirements set by society, such as taking issues of risk mitigation into account, and they should be quantified to the extent possible and stated in such a way that one can tell if a given design meets them. (HS-ETS1-1).
College, Career, and Civic Life
D2.Geo.8.9-12. Evaluate the impact of economic activities and political decisions on spatial patterns within and among urban, suburban, and rural regions.
National Geography Standards:
Geography Standard 12. The processes, patterns, and functions of human settlement
Prior Standards: Anticipated Prior Knowledge
Next Generation Science Standards
MS-ETS1-3. Analyze data from tests to determine similarities and differences among several design solutions to identify the best characteristics of each that can be combined into a new solution to better meet the criteria for success.
College, Career, and Civic Life
D2.Geo.8.6-8. Analyze how relationships between humans and environments extend or contract spatial patterns of settlement and movement.
LEARNING TARGETS
By the end of this module students will be able to articulate how housing contributes to the quality of life in their community. They will do this by creating a typology of the condition of housing for a specified area in the neighborhood through fieldwork, using geospatial technology, secondary data, and mapping. Students will consider what factors contribute to the condition of housing and offer solutions to any challenges, such as neglected or abandoned properties, they discover related to housing.
CONTENT BACKGROUND
“Quality of Life” is a very broad concept that encompasses diverse issues affecting the lives of people including housing, health, education, income, access to basic needs, recreation etc. It “encompasses multidimensional factors that include everything from physical health, psychological state, level of independence, family, education, wealth, religious beliefs, a sense of optimism, local services and transport, employment, social relationships, housing and the environment” (Source: http://www.forbes.com/sites/iese/2013/09/04/quality-of-life-everyone-wants-it-but-what-is-it/#7aee9d662c7d).
The ‘Human Development Index (HDI) is a summary measure of average achievement in key dimensions of human development’ (UNDP). It is a measure closely related to quality of life, and is used to compare two or more countries. The United Nations developed the HDI based on three main dimensions: long and healthy life, knowledge, and a decent standard of living (see Image below).
Figure 1: Indicators of HDI

Source: http://hdr.undp.org/en/content/human-development-index-hdi
In 2015, the United States ranked 8th among all countries in Human Development, ranking behind countries like Norway, Australia, Switzerland, Denmark, Netherlands, Germany and Ireland (UNDP, 2015).
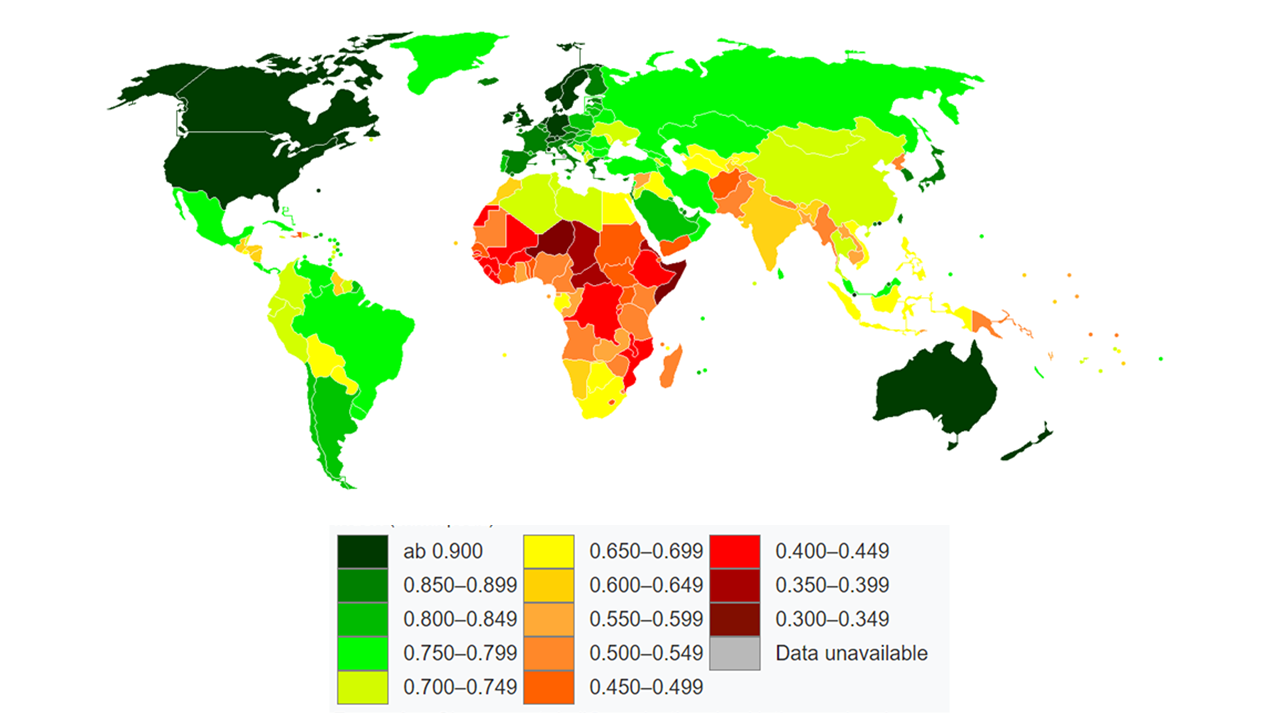
The closer a country is to 1.0 on the HDI index, the better its standing in regards to human development. Maps of HDI ranking reveal regional patterns, such as the low HDI in Sub-Saharan Africa (Figure 2).
Figure 2. The United Nations Human Development Index (HDI) rankings for 2014
Housing is an important component of “quality of life.” In this lesson, students will explore the connections between economy and housing using their communities as case studies.
ENGAGE
Understanding Quality of Life
A. Brainstorming the Meaning of Quality of Life: Student Resource I
- Individually, students will list six factors that affect their quality of life.
- Students will then rank those factors in order of importance.
- Next, students will write a definition of “quality of life.”
- Students will discuss their factors and definitions in small groups.
B. Defining Quality of Life: Student Resource II
- Students will come together as a whole class sharing ideas about the factors they listed and their definitions. The class should work together to create a consensus class definition of quality of life.
- They will compare their definition with the following definition of Quality of Life:
“Quality of life (QOL) is a broad multidimensional concept that usually includes subjective evaluations of both positive and negative aspects of life. What makes it challenging to measure is that, although the term “quality of life” has meaning for nearly everyone and every academic discipline, individuals and groups can define it differently. Although health is one of the important domains of overall quality of life, there are other domains as well—for instance, jobs, housing, schools, the neighborhood. Aspects of culture, values, and spirituality are also key domains of overall quality of life that add to the complexity of its measurement.”
Source: https://www.cdc.gov/hrqol/concept.htm
C. Discussion: Appendix A
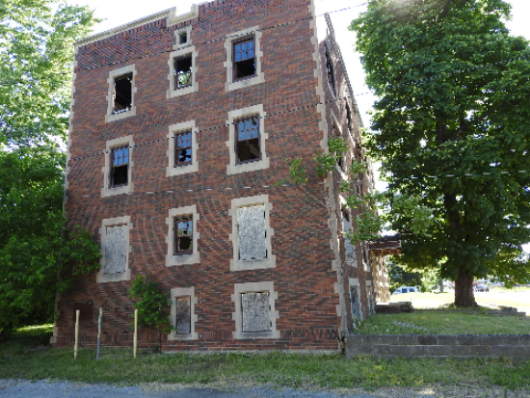
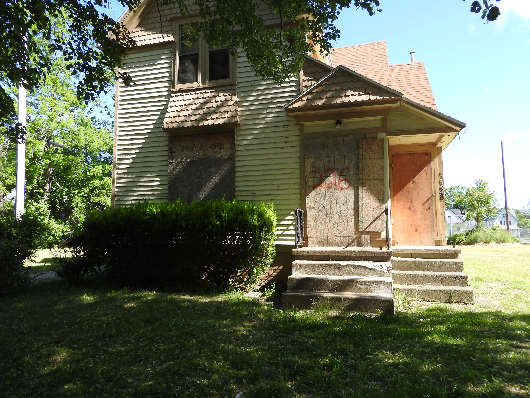
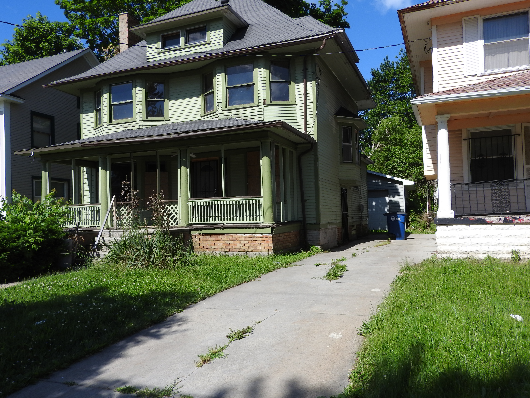
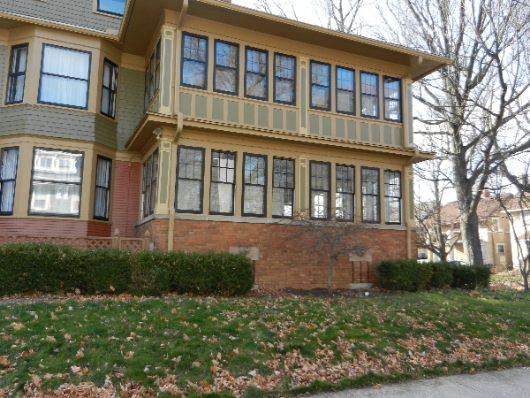
- Show images of different types of housing available in the community (e.g. single family houses, apartments, duplexes) in different types of neighborhoods as applicable to your community (e.g. urban, suburban and/or rural). Use a range of housing in varying conditions from poor to excellent also. Discuss quality of life in the community through the lens of housing. [Note: You can find images through Google Street View, houses for sale in your community, and local databases of housing and their values.]
D. Assessment: Student Resource III
- Per the definition above, quality of life includes both positive and negative aspects of community life. Ask students to identify three positive aspects and three negatives aspects of their community, and justify their choices.
E. Evaluation
1. Assign a score based on their responses and explanations.
EXPLORE
Quality of Life in the Context of Housing in the Community
A. What do they know? Student Resource IV
1. Given a map of the neighborhood around the school (or a nearby neighborhood), assign a group of 3-4 students to a specific street to explore. Have the students highlight the specific block or block on the street that you would like them to study on the map.
2. Ask students to brainstorm what they know about housing on their assigned street.
3. Ask them what they would like to know about housing on this street.
4. Have the students write a hypothesis about the quality of housing on their assigned street.
B. Exploring Housing Remotely: Student Resource V
1. In their groups students will explore their street through on-line sources first. There are a number of options depending on the availability of databases in your community. One possibility is Google Maps: https://www.google.com/maps/. Students will enter their street, city, and state. They can use “Street View” to browse the housing stock on the blocks of their street. They should note their general impressions about the quality of the housing.
2. Students will make a checklist of at least three factors to compare and contrast each of the houses on their assigned blocks (e.g. condition of the roof, windows, paint, yard, or presence/absence of trash).
3. In “Street View” it is possible to click on each house individually (the address along with the date of the image will appear in a box in the top left corner of the screen). Students should make a list of all of the addresses on their assigned block and grade each of them from A to F for each of the chosen factors from Step 2. (A=Very Good, B=Good, C=Average, D=Fair, F=Poor). For example, for House 1 students will determine what grade the roof should receive, what grade the yard should receive, and what grade the structural condition should receive (if these are the factors they have chosen). The roof might have a C, while the yard is graded B.
4. Based on the rankings of each of their chosen factors, students will give each house an overall grade.
C. Fieldwork in the Neighborhood: Student Resource VI
1. In small groups, students will examine their assigned block/s to compare their analysis from on-line sources to what is actually on the ground today. Assign at least one study to be a note-taker, one to use the GPS unit, and one to take pictures with a GPS-enabled camera. They can use Resource VI to help guide them in this process:
2. With their list of addresses, students should proceed from house to house to assess the same criteria they used above (e.g. condition of roof, yard, and so on.). They also have space to make notes of any other observations they would like to make, such as any major changes between what they viewed on-line and what they see currently in person.
3. Students will take photos with a GPS enabled cameras (or smartphones) and tag each property with their GPS unit. This will allow them to produce maps later if desired, and to integrate images into their presentations.
4. Back in the classroom, students will compare and contrast the criteria rankings made by examining the on-line images and the observations they made while in the neighborhood.
5. Based on their comparisons, they should adjust any of the overall grades for houses they made earlier.
6. Students should present their findings, especially any interesting discoveries they made.
7. Finally, a general discussion on the value of fieldwork in research could complete this section.
Note: Although fieldwork is a valuable experience, it can be optional if time is limited or it is not possible to go the assigned neighborhoods.
D. Assessment
1. Students will create a brief presentation of their research process and findings, including the criteria that they graded for each property, and their findings. They should integrate images from the Internet and/or those that were taken by them in the field.
E. Evaluation: Student Resource VII
1. Use a rubric to evaluate how well students met the requirements of the presentation, including format, content, number and quality of image/maps, and participation of all group members in the presentation.
EXPLAIN
Examining secondary sources to explain community housing
A. Explaining the Differences in Housing through Secondary Data: Student Resource VIII
1. Students will consult available community housing databases to understand the conditions on their block. For example, in Toledo, Ohio there are a couple of valuable sources that offer insights into the quality and value of individual properties that can provide some perspective to students. Similar sources can be found at local and county levels for communities throughout the United States. See Appendix B for Examples of sources. Student Resource VIII should be used for each website examined by students.
B. Assessment: Student Resource IX
1. Individually, students will reflect on their discoveries from their work in the Explore and Explain sections to consider how housing affects the quality of life. Provide the students with a writing prompt (Student Resource IX) and guidelines for length and format.
C. Evaluation
1. Provide a rubric with the writing prompt.
CHALLENGES: Going further to explain differences in housing
Challenge 1: Abandoned (or Neglected) Properties and Housing Values
For student groups that discovered abandoned or neglected properties on their block/s, they could explore whether or not this has impacted the value of neighboring properties. Many counties keep track of home values for tax purposes. If students can determine from the website when a property became unoccupied, they could examine the values of neighboring properties to see if their values declined. While causation can’t be assumed, they could examine the relationship. There may also be foreclosure data or reports available, particularly since the recession and housing crisis began in 2008.
Challenge 2: Lead Paint and Housing
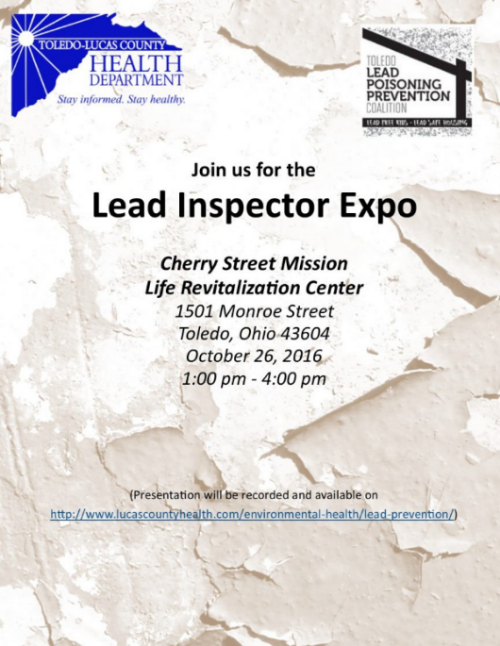
Some communities with older housing stock have lead abatement programs in place. As a result, they may have databases for students to search to determine whether or not the houses on their block/s have been impacted by lead. The county health department may have data available for this purpose. This challenge has important connections to health, a key factor in quality of life. See for example, the lead prevention resources for Lucas County, Ohio: http://www.lucascountyhealth.com/environmental-health/lead-prevention-2/ (Appendix C).
APPLY
Connecting Research to Potential Solutions
A. In their groups students will identify one to two potential challenges in the neighborhood based on their research and other group’s results, and potential solutions to those issues (Student Resource X).
B. Assessment: Student Resource XI
Students will continue to work in their groups to consider potential solutions to any housing and/or infrastructure issues on their assigned block/s. They will present a plan for neighborhood improvement by writing a letter to the City outlining what they have learned about the neighborhood, including their potential solutions (Student Resource XI).
C. Evaluation
Students’ solutions could be evaluated by integrating elements of the NGSS standard that serves as a focus for this module (page 2) into the assignment and the evaluation rubric.
HS-ETS1-3. Evaluate a solution to a complex real-world problem based on prioritized criteria and trade-offs that account for a range of constraints, including cost, safety, reliability, and aesthetics, as well as possible social, cultural, and environmental impacts.
CONNECTIONS
Real World Experience to Connect to Educational and Career Paths
A. One way to connect housing and quality of life to potential careers is to invite guest speakers from the community to visit the classroom. These could include any of the following organizations or people, who might be engaged in dealing with housing and neighborhood issues:
- Urban Planner
- Urban Geographers
- Local and County Governments
- Neighborhood Organizations
- GIS Specialists
- Nonprofit Organizations, such as Habit for Humanity or United Way
-
Land Banks
B. Assessment
Student Resource XII includes questions that students should be prepared to ask of the presenter/s. While not all students will be able to ask the questions, each of them will write down the speaker’s responses. This will serve the purpose of not only reinforcing the careers connections, but also keeping the students engaged in the presentation.
C. Evaluation
Students can be evaluated on effort and complete answers to the questions.
EXTEND
Compare/Contrast: Measuring Quality of Life Globally
Students will compare the quality of life of various countries by comparing and contrasting social, demographic and economic statistics. Student Resource XIII includes the country data and Student Resource XIV is the related questions. This step extends the topic beyond the local scale and housing to the global scale.
STUDENT RESOURCES
- Student Resource I - Quality of Life
- Student Resource II- Defining Quality of Life
- Student Resource III - Quality of Life in the Community
- Student Resource IV - Exploring Quality of Life in our Community
- Student Resource V - Exploring Your Street Virtually
- Student Resource VI - Exploring Your Street through Fieldwork
- Student Resource VII - Group Housing Presentation Rubric
- Student Resource VIII - Explaining Housing Conditions through Secondary Sources
- Student Resource IX - Reflections on Housing and Quality of Life
- Student Resource X - Connecting Research to Potential Solutions
- Student Resource XI - Proposing Your Solutions
- Student Resource XII - Questions for Guest Speakers
- Student Resource XIII - Measuring Quality of Life Country Statistics
- Student Resource XIV - The Human Development Index: Measuring the Quality of Life
ADDITIONAL RESOURCES
1. Forbes article on Quality of Life: http://www.forbes.com/sites/iese/2013/09/04/quality-of-life-everyone-wants-it-but-what-is-it/#141a49052c7d
2. Census Data from http://www.census.gov/
3. American Community Survey http://www.census.gov/programs-surveys/acs/
4. Google Earth application downloadable at https://www.google.com/earth/download/ge/agree.html
5. National Geography (What the World Eats): http://www.nationalgeographic.com/what-the-world-eats/
REFERENCES
College, Career, and Civic Life (C3) Framework for Social Studies State Standards. Access: http://www.socialstudies.org/c3 (last accessed February 2017).
Food and Agriculture Organization of the United Nations. Access: www.fao.org (last accessed February 2017).
Geography for Life, National Geography Standards, Second Edition. 2012. Access: http://www.ncge.org/geography-for-life
Next Generation Science Standards. Access: http://www.nextgenscience.org/ (last accessed February 2017).
Population Data Sheet. 2016. Population Reference Bureau. Access: http://www.prb.org/pdf16/prb-wpds2016-web-2016.pdf (last accessed February 2017).
UNDP (2016). Human Development Report 2015. http://hdr.undp.org/sites/default/files/2015_human_development_report.pdf
United Nations Human Development Map 2014. https://commons.wikimedia.org/wiki/File:UN_Human_Development_Report_2015.svg
The World Bank. Access: www.worldbank.org (last accessed February 2017).
Appendix A
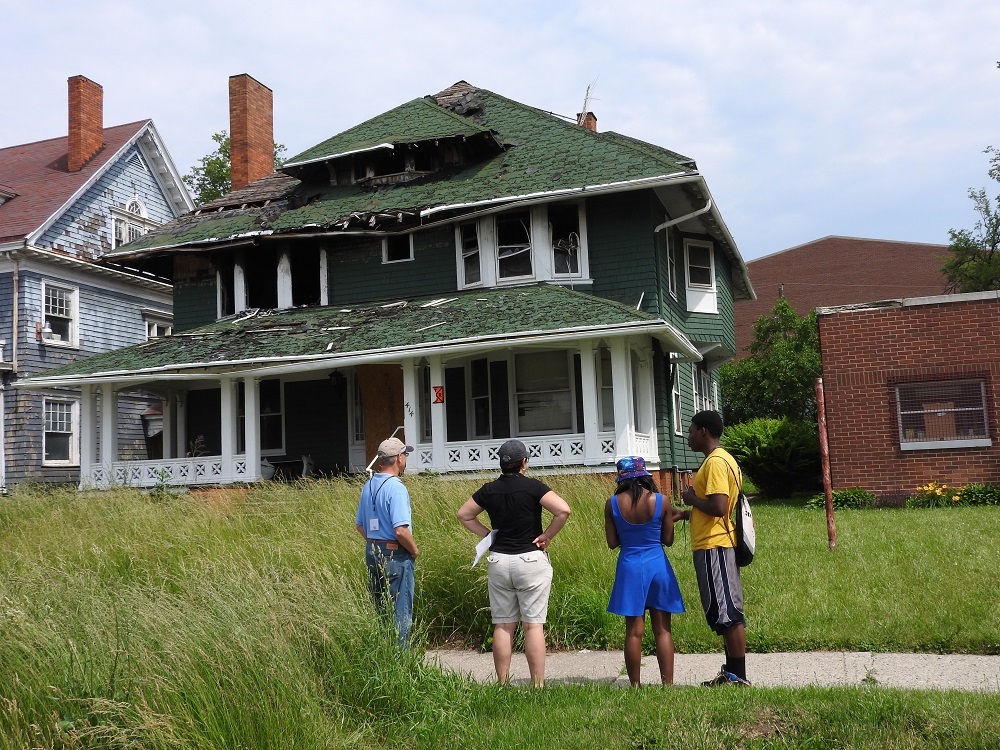
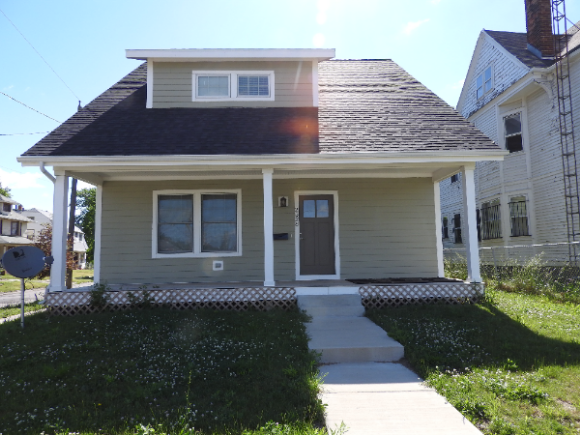
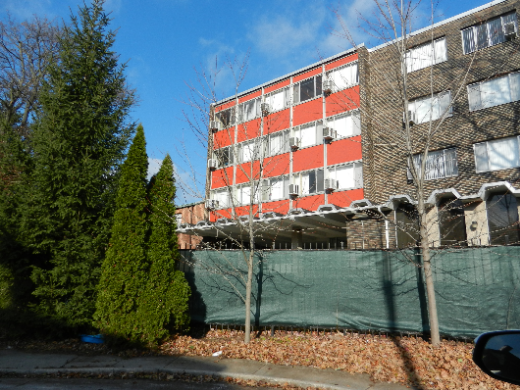
Here are few examples of images of houses and apartments in the neighborhood around the same high school in Toledo, Ohio. Choose a mix of types and conditions for discussion purposes. (All photos taken by author).
Appendix B
These are two examples of secondary sources that students can use to explore more information about the houses on their assigned block/s.
1. Lucas County Land Bank Housing Inventory
Access: http://thelandbank.maps.arcgis.com/apps/webappviewer/index.html?id=71f19902da2248a6a2a2721672d38aa3
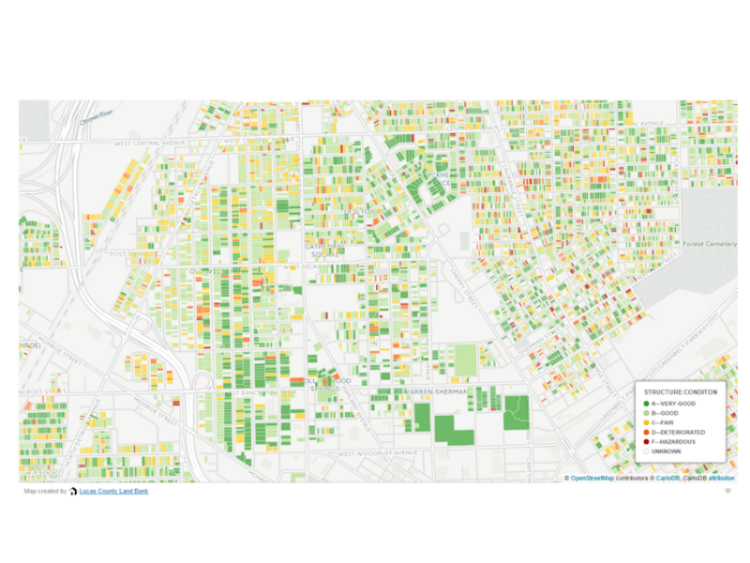
This source is searchable by address, so students can compare their results to the grades given by the Survey staff.
Example of Map from the Lucas County Land Bank Survey:
This database has a wide variety of layers that can provide specific details to students about specific characteristics of properties, some of which may match the ones that students examined.
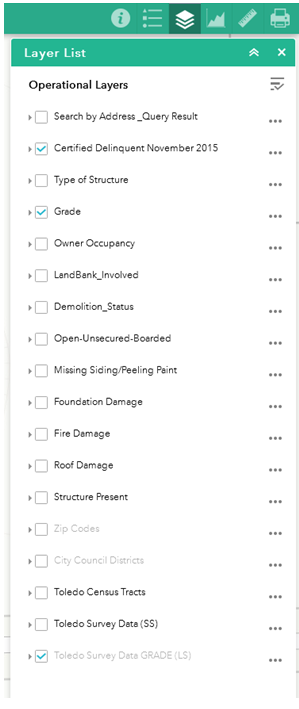
This can be quite valuable to students in both the information provided as well as giving them the opportunity to develop their spatial thinking skills further.
2. Lucas County Auditor’s Real Estate Information System (AREIS)
Access: http://icare.co.lucas.oh.us/LucasCare/search/commonsearch.aspx?mode=address
This source, which is also searchable by address, provides detailed information about properties, including owners (if occupied), values over time, pictures, maps, and much more.
After entering the address, select “residential attributes” from the list in the left column. Scroll down to reveal both the grade and condition of the property according to the county.
Appendix C
An Advertising Flyer for Community Members
