

Program Goals and Outcomes
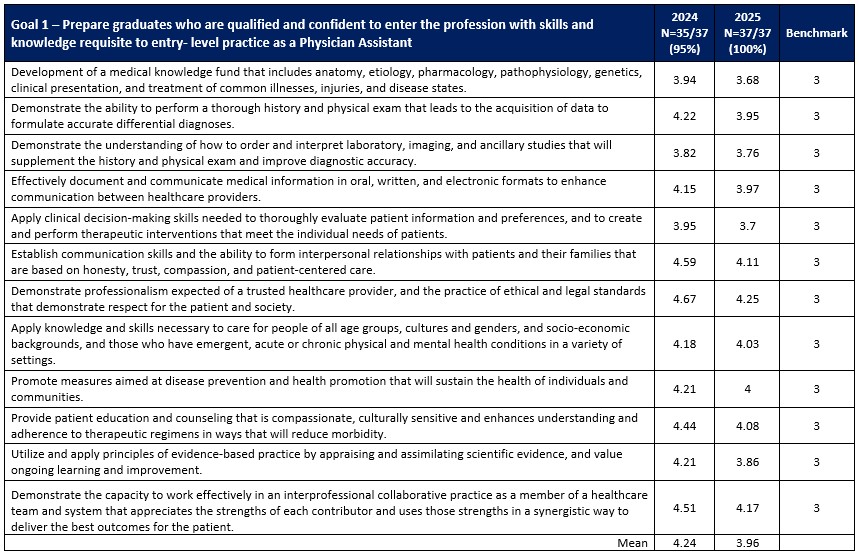
Goal 1 - Prepare graduates who are qualified and confident to enter the profession with skills and knowledge requisite to entry- level practice as a Physician Assistant
Benchmark for meeting this goal:
- PANCE first time pass rate will meet or exceed the national pass rate
- PAEA End of Curriculum Exam average cohort score will meet or exceed national average
- OSCEs students will acheive >70% average of all components
- End of Program Survey questions on confidence will have an average rating of “moderately confident” in all competency areas. This is measured on a Likert scale with 1 –Not confident; 2 – slightly confident; 3- moderately confident; 4 - very confident; 5 - extremely confident
The Physician Assistant Program evaluates Goal 1 through multiple objective and subjective outcome measures, including PANCE first-time pass rates, End of Curriculum (EOC) exam performance, Objective Structured Clinical Examinations (OSCEs), and end-of-program student self-assessment of confidence across core competency domains.
PANCE Performance:
The program benchmark is for the first-time PANCE pass rate to meet or exceed the
national pass rate. This benchmark was met by the Classes of 2020, 2021, and 2023.
The Class of 2022 and Class of 2024 did not meet this benchmark, with pass rates of
90% and 85% respectively, compared to national averages of 92%. These cohorts are
closely reviewed to identify curricular, assessment, and student support factors that
may have contributed to these outcomes. The Class of 2025 national pass rate data
is pending at the time of reporting.

End of Curriculum Examination:
The benchmark for the PAEA End of Curriculum Exam is for the cohort mean score to
meet or exceed the national mean. This benchmark was met for all cohorts from 2021
through 2025. UToledo cohort averages consistently met or exceeded national means,
demonstrating strong foundational medical knowledge across graduating classes.

OSCE Performance:
The program benchmark for OSCEs is an overall average score greater than 70%. This
benchmark was met for the Classes of 2024 and 2025, with average scores of 80.16%
and 88.8% respectively. Additionally, 100% of students in both cohorts achieved scores
above the 70% benchmark, indicating consistent attainment of clinical skills and readiness
for entry-level practice.

Student Confidence:
End-of-Program survey data demonstrated that graduating students rated themselves
at or above the benchmark of “moderately confident” (Likert score ≥3) across all assessed
competency domains for both the Classes of 2024 and 2025. Average confidence scores
ranged from 3.68 to 4.67, with overall cohort averages of 4.24 (Class of 2024) and
3.96 (Class of 2025). These results indicate that graduates feel confident in their
medical knowledge, clinical skills, professionalism, communication abilities, and
readiness for collaborative practice.
Conclusion:
Overall, Goal 1 is partially met. While the program consistently meets benchmarks related to curriculum mastery, clinical
skills, and graduate confidence, variability in PANCE pass rates for select cohorts
warrants continued monitoring and targeted programmatic improvements to ensure sustained
national benchmark performance.
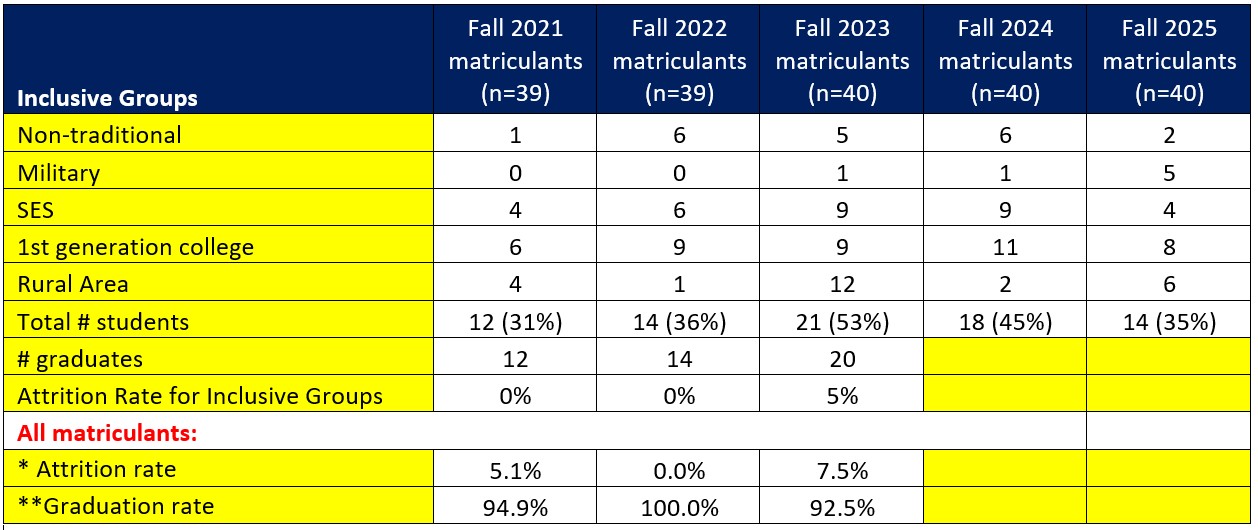
Goal 2 - To provide an inclusive environment by admitting and retaining students having one or more of the following attributes: non-traditional (> 25 years old), 1st generation college, military, rural areas and economically disadvantaged (as defined and reported by CASPA).
Benchmark for meeting this goal:
- 20% of matriculating class has one or more of the above attributes
- Attrition rate below the ARC reporting threshold (10.7%)
The Physician Assistant Program is committed to fostering an inclusive learning environment through intentional admissions practices and student support systems. Goal 2 is evaluated through demographic analysis of matriculating classes and program attrition and graduation rates.
Inclusive Admissions:
The benchmark for this goal is that at least 20% of each matriculating class possesses
one or more identified inclusive attributes. This benchmark was exceeded for all cohorts
from Fall 2021 through Fall 2025. The percentage of students with one or more inclusive
attributes ranged from 31% to 53% across cohorts, demonstrating consistent success
in attracting a diverse applicant pool reflective of the program’s mission and the
communities it serves.
Retention and Attrition:
The program benchmark for attrition is to remain below the ARC-PA reporting threshold
of 10.7%. This benchmark was met for all cohorts evaluated. Attrition rates for inclusive
groups were 0% for the Fall 2021 and Fall 2022 cohorts and 5% for the Fall 2023 cohort.
Overall program attrition rates ranged from 0% to 7.5%, with graduation rates between
92.5% and 100%.
Conclusion:
Goal 2 is met. The program consistently exceeds benchmarks for inclusive admissions while maintaining
attrition rates well below national reporting thresholds, indicating both successful
recruitment and effective retention of students from diverse backgrounds.
Goal 3 - Engage students in community-based service that promotes cultural humility, health equity, and patient-centered care for individuals from varied backgrounds and underserved populations.
Benchmark for meeting this goal:
- All students to serve in an underserved clinic at least 3 times during didactic curriculum
- All students to serve in the community, outside of medical service, at least 1 time during didactic learning
- An average of ≥ 3.5 on End of Program survey question on preparedness in caring for underserved populations
The Physician Assistant Program assesses Goal 3 through student participation in community service activities, service in underserved clinical settings during the didactic phase, and student perceptions of preparedness to work with underserved populations.
Community Engagement:
The benchmark for this goal requires all students to serve in an underserved clinic
at least three times during the didactic curriculum and to participate in at least
one non-medical community service activity. Participation data demonstrate that 100%
of students in the Classes of 2024, 2025, and 2026 completed a minimum of three service
days during the didactic phase. A majority of students exceeded this benchmark, with
many volunteering monthly at local free clinics.

Student Leadership and Partnerships:
Student involvement is supported by SAAAPA representatives who serve as liaisons to
local free clinics and assist with onboarding and training. Additionally, the program
benefits from strong faculty leadership and community partnerships, including collaboration
with the CCC, Halim, and Community of Hope clinics and participation in international
medical missions. Most recently, five students participated in a medical mission to
Guatemala in December 2025.

Student Preparedness:
End-of-Program survey data indicate that students feel well prepared to work with
underserved populations. Mean scores exceeded the benchmark of 3.5 for both the Classes
of 2024 (4.43) and 2025 (4.34).

Conclusion:
Goal 3 is met. Students consistently exceed service participation benchmarks and report high levels
of preparedness to provide care to underserved populations, reflecting the program’s
commitment to cultural humility and health equity.
Goal 4 - Principal faculty demonstrate excellence through contributions in education and scholarship.
Benchmark for this goal:
- An average score of ≥ 3.5 on Course evaluations of faculty
- An average score of ≥ 3.5 on each of the below questions taken from the End of Didactic
survey
- PA Program Faculty are knowledgeable and provide effective teaching in their subject area.
- The faculty was available for questions and advising.
- The faculty were willing to assist me when I asked for help.
- Scholarship (presentations/ publications each year) average of 1 per faculty per year
- Scholarly project advising
- >2 students/faculty member
- Scholarly project advising
The Physician Assistant Program evaluates faculty excellence through teaching effectiveness, engagement in interprofessional education (IPE), community outreach, and scholarly productivity.
Educational Contributions:
Principal faculty actively contribute to education within and outside the PA program
through interprofessional education initiatives, pipeline programs, outreach to local
high schools, ambassador programs, and teaching in settings beyond the PA curriculum.
Faculty teaching effectiveness is assessed through course evaluations and End-of-Didactic
surveys, with a benchmark score of 3.5 out of 5. Faculty consistently meet or exceed
this benchmark, demonstrating effective instruction and student engagement.


Scholarship and Mentorship:
The program benchmark for scholarship is an average of at least one scholarly product
(presentation or publication) per principal faculty member per year. Faculty met or
exceeded this benchmark in 2025, with multiple peer-reviewed publications and professional
presentations. In addition, all principal faculty participate in advising student
scholarly projects, with the number of advisees ranging from two to five students
per faculty member, reflecting equitable mentorship distribution and strong faculty
engagement in student scholarship.

Conclusion:
Goal 4 is met. Principal faculty demonstrate sustained excellence in teaching, mentorship, service,
and scholarship, supporting both student success and the academic mission of the program.
PHYSICIAN ASSISTANT NATIONAL CERTIFYING EXAMINATION (PANCE) SCORES
The Physician Assistant National Certification Examination (PANCE) is the national
certifying examination offered by the National Commission on Certification of Physician
Assistants (NCCPA). A passing score is necessary to practice in most states.
Please find the most current PANCE Exam Peformance Summary Report showing our Pass Rates of the last five graduating classes.
STUDENT ATTRITION/GRADUATION RATE
| Class of 2023 | Class of 2024 | Class of 2025 | |
| Maximum entering class size (as approved by ARC-PA) | 40 | 40 | 40 |
| Entering Class Size | 39 | 40 | 40 |
| Graduates | 37 | 40 | 37 |
| *Attritition Rate | 5.1% | 0% | 7.5% |
| **Graduation Rate | 94.9% | 100% | 92.5% |
*Attrition rate calculation: Number of students who attritted from cohort divided by
the entering class size.
**Graduation rate: Number of cohort graduates divided by the entering class size.
Download the ARC-PA Graduation Rate Template