Medical School Class Profile of 2017 Entering Class
Class profiles: 2024 | 2023 | 2022 | 2021 | 2020 | 2019 | 2018 | 2017 | 2016 | 2015

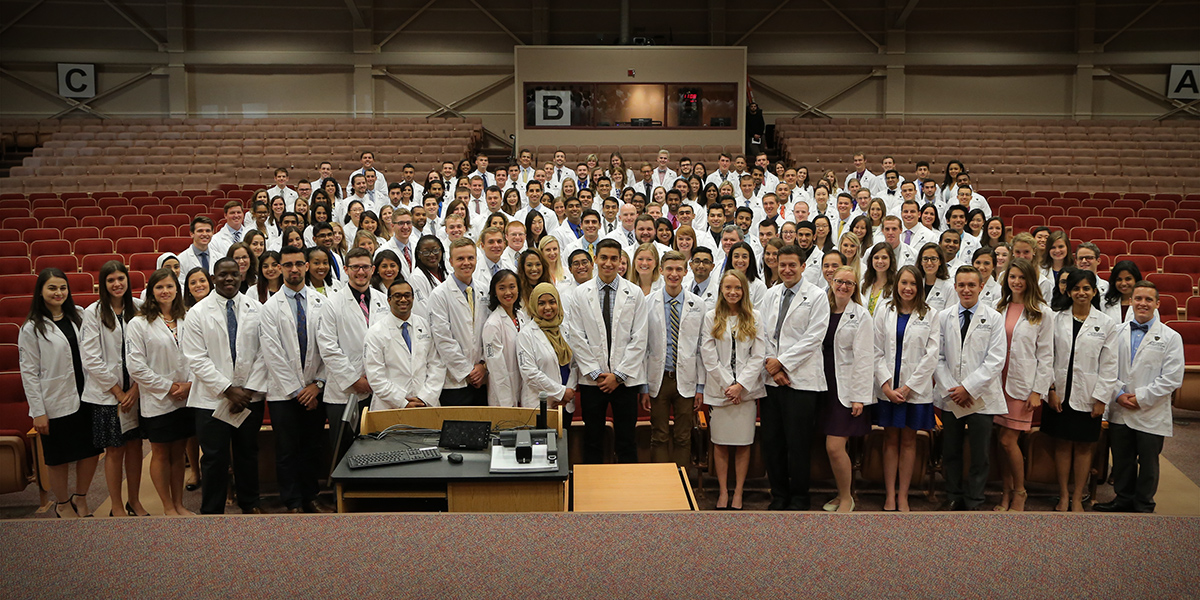
Here is the 2017 Entering Medical Class Profile for the University of Toledo College of Medicine and Life Sciences:
APPLICATIONS RECEIVED
Ohio Residents: 1143
Non-Ohio Residents: 2941
TOTAL: 4115
Non-Ohio Residents: 2941
TOTAL: 4115
ENTERING CLASS SIZE
Ohio Residents (77%): 135
Non-Ohio Residents (23%): 40
Male (51%): 89
Female (49%): 86
TOTAL: 175
Non-Ohio Residents (23%): 40
Male (51%): 89
Female (49%): 86
TOTAL: 175
Academics & Test Results
Academic Performance
Average Total GPA: 3.66
Average Total Science GPA: 3.55
Average Total Graduate GPA: 3.68
MCAT Results
Average Total MCAT: 509 (80th percentile)
32
Students from
Northwest Ohio
69
Colleges
Represented
19
Ohio Colleges
Represented
Major Colleges Represented
- Bowling Green State University
- Case Western Reserve University
- Cornell University
- Denison University
- Duke University
- John Carroll University
- Johns Hopkins University
- Loyola University Chicago
- Miami University
- University of Notre Dame
- Ohio State University
- Ohio University
- University of Akron
- University of California
- University of Dayton
- University of Miami
- University of Michigan
- University of Toledo
- University of Virginia
- Xavier University
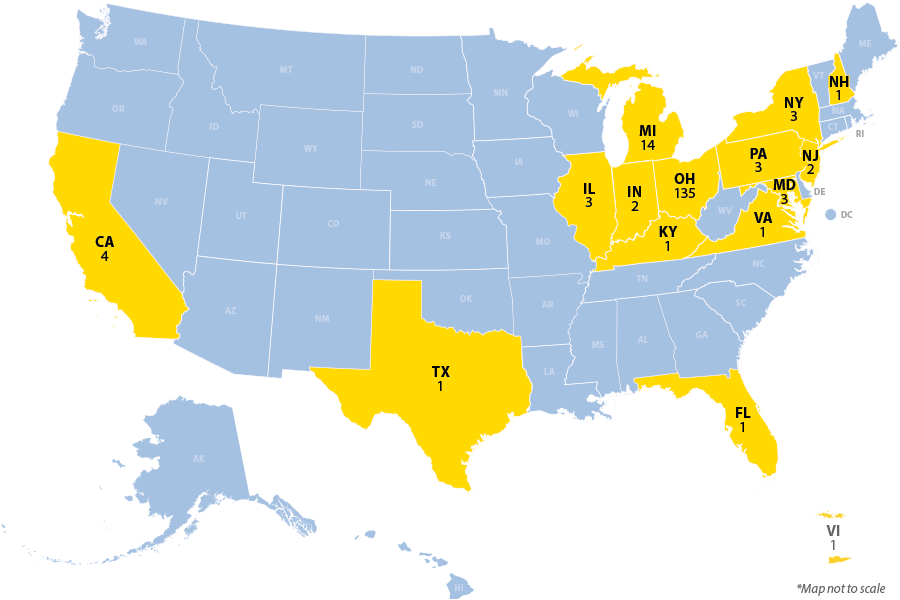
15 States Represented
- California (4)
- Florida
- Illinois (3)
- Indiana (2)
- Kentucky
- Maryland (3)
- Michigan (14)
- New Hampshire
- New Jersey (2)
- New York (3)
- Ohio (135)
- Pennsylvania (3)
- Texas
- Virginia
- Virgin Islands
Age
Age Mean: 23
Age Range: 20-39
Age Range: 20-39
Highest Degree Awarded
Bachelor's: 175
Master's: 35
Pharm.D.: 1
Master's: 35
Pharm.D.: 1


