Class profiles: 2024 | 2023 | 2022 | 2021 | 2020 | 2019 | 2018 | 2017 | 2016 | 2015
M.D. 2022 Entering Class Profile
Here is the 2022 Entering Medical Class Profile for the University of Toledo College of Medicine and Life Sciences:
ENROLLMENT
176 students
63%
Ohio
Residents
53%
Female
35%
From Northwest
Ohio
APPLICATIONS RECEIVED
Non-Ohio Residents: 5,138
TOTAL: 6,319
ENTERING CLASS SIZE
- Students from Northwest Ohio (38%): 42
- Remaining Ohio (62%): 69
Non-Ohio Residents (37%): 65
Male (47%): 83
Female (53%): 92
TOTAL: 176
Academics & Test Results
Academic Performance
Average Total GPA: 3.72
Average Total Science GPA: 3.61
Average Total Graduate GPA: 3.85
MCAT Results
Average Total MCAT: 509 (75th percentile)

111
Ohio Residents

21
States Represented
42
Students from
Northwest Ohio
65
Colleges
Represented
17
Ohio Colleges
Represented
Major Colleges Represented
- Allegheny College
- Arizona State University
- Baldwin Wallace University
- Bluffton University
- Bowling Green State University
- Brandeis University
- Brigham Young University
- Brown University
- Butler University
- Carleton College
- Case Western Reserve University
- Chapman University
- Clemson University
- Cornell University
- DePaul University
- Emory University
- Georgia Institute of Technology
- Grand Valley State University
- Hamilton College (Clinton, NY)
- Hillsdale College
- Iowa State University
- John Carroll University
- Kenyon College
- Lebanon Valley College
- Marshall University
- Miami University
- Michigan State University
- Mount Vernon Nazarene University
- New Jersey Institute of Technology
- Nova Southeastern University
- The Ohio State University Main Campus
- Oregon State University
- Rutgers University New Brunswick Campus
- Texas A & M University
- The University of Akron
- University of Alabama at Birmingham
- University of California-Berkeley
- University of California-San Diego
- University of California-Santa Cruz
- University of Central Florida
- University of Cincinnati
- University of Dayton
- University of Florida
- University of Illinois at Chicago
- University of Illinois at Urbana-Champaign
- University of Maryland-Baltimore County
- University of Miami
- University of Michigan
- University of Mount Union
- University of North Carolina at Chapel Hill
- University of Northern Colorado
- University of Notre Dame
- University of Pittsburgh
- University of South Alabama
- University of South Florida
- The University of Toledo
- University of Virginia
- University of Washington-Bothell Branch
- Vanderbilt University
- Villanova University
- Washington University in St. Louis
- Wright State University
- Xavier University
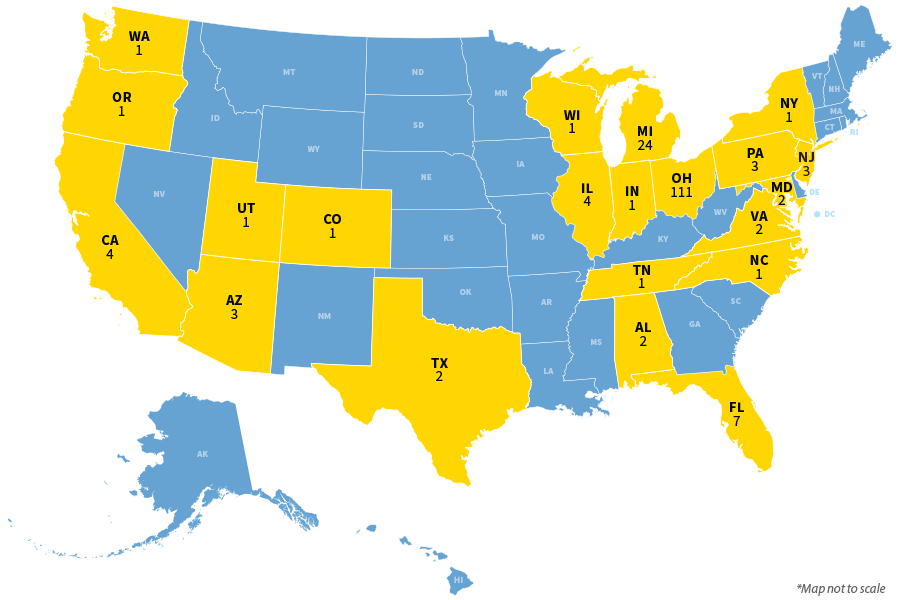
21 States Represented
- Alabama (2)
- Arizona (3)
- California (4)
- Colorado
- Florida (7)
- Illinois (4)
- Indiana
- Maryland (2)
- Michigan (24)
- New Jersey (3)
- New York
- North Carolina
- Ohio (111)
- Oregon
- Pennsylvania (3)
- Tennessee
- Texas (2)
- Utah
- Virginia (2)
- Washington
- Wisconsin
Age
Age Range: 20-33
Highest Degree Awarded
Master's: 38


