

Medical School Class Profile of Entering Class
Class profiles: 2024 | 2023 | 2022 | 2021 | 2020 | 2019 | 2018 | 2017 | 2016 | 2015

M.D. 2020 Entering Class Profile
Here is the 2020 Entering Medical Class Profile for the University of Toledo College of Medicine and Life Sciences:
ENROLLMENT
176 students
70%
Ohio
Residents
51%
Female
39%
From Northwest
Ohio
APPLICATIONS RECEIVED
Ohio Residents: 1,148
Non-Ohio Residents: 4,967
TOTAL: 6,115
Non-Ohio Residents: 4,967
TOTAL: 6,115
ENTERING CLASS SIZE
Ohio Residents (70%): 124
- Students from Northwest Ohio (39%): 48
- Remaining Ohio (61%): 76
Non-Ohio Residents (30%): 52
Male (49%): 86
Female (51%): 90
TOTAL: 176
- Students from Northwest Ohio (39%): 48
- Remaining Ohio (61%): 76
Non-Ohio Residents (30%): 52
Male (49%): 86
Female (51%): 90
TOTAL: 176
Academics & Test Results
Academic Performance
Average Total GPA: 3.65
Average Total Science GPA: 3.55
Average Total Graduate GPA: 3.81
MCAT Results
Average Total MCAT: 508 (74th percentile)

124
Ohio Residents

18
States Represented
48
Students from
Northwest Ohio
56
Colleges
Represented
18
Ohio Colleges
Represented
Major Colleges Represented
- Bowling Green State University
- Brigham Young University
- Case Western Reserve University
- Cedarville University
- Cleveland State University
- Cornell University
- John Carroll University
- Miami University
- Michigan State University
- The Ohio State University
- Ohio University
- University of California-Davis
- University of California-San Diego
- University of Cincinnati
- University of Dayton
- University of Florida
- University of Illinois at Urbana-Campaign
- University of Michigan
- University of Notre Dame
- University of Pittsburgh
- University of South Carolina Columbia
- University of Southern California
- University of Tampa
- University of Toledo
- Washington University in St. Louis
- Wayne State University
- West Virginia University
- Wheaton College
- Wright State University
- Youngstown State University
18 States Represented
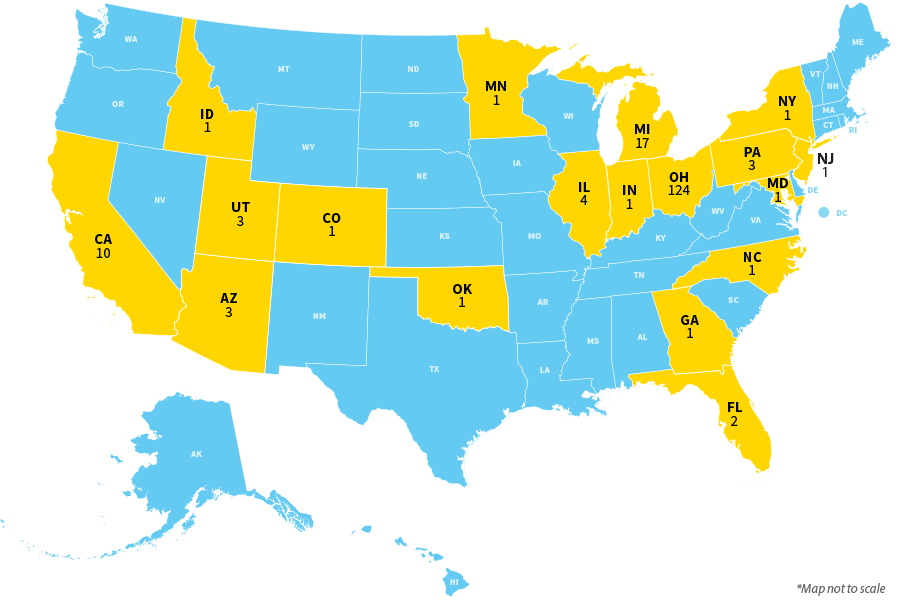
- Arizona (3)
- California (10)
- Colorado
- Florida (2)
- Georgia
- Idaho
- Illinois (4)
- Indiana
- Maryland
- Michigan (17)
- Minnesota
- New Jersey
- New York
- North Carolina
- Ohio (124)
- Oklahoma
- Pennsylvania (3)
- Utah (3)
Age
Age Mean: 23
Age Range: 20-44
Age Range: 20-44
Highest Degree Awarded
Bachelor's: 176
Master's: 49
Ph.D.: 1
Master's: 49
Ph.D.: 1